Help

Re: Base Design for Analytics

1181 0
cancel
Showing results for 
Search instead for 
Did you mean: 
Allen_Wixted
5 - Automation Enthusiast

Hi All,

Struggling to get the following functionality into a base and hoping you can help a novice here.

We are attempting to use Airtable to track & visualise AWS logs for interactions with our service.

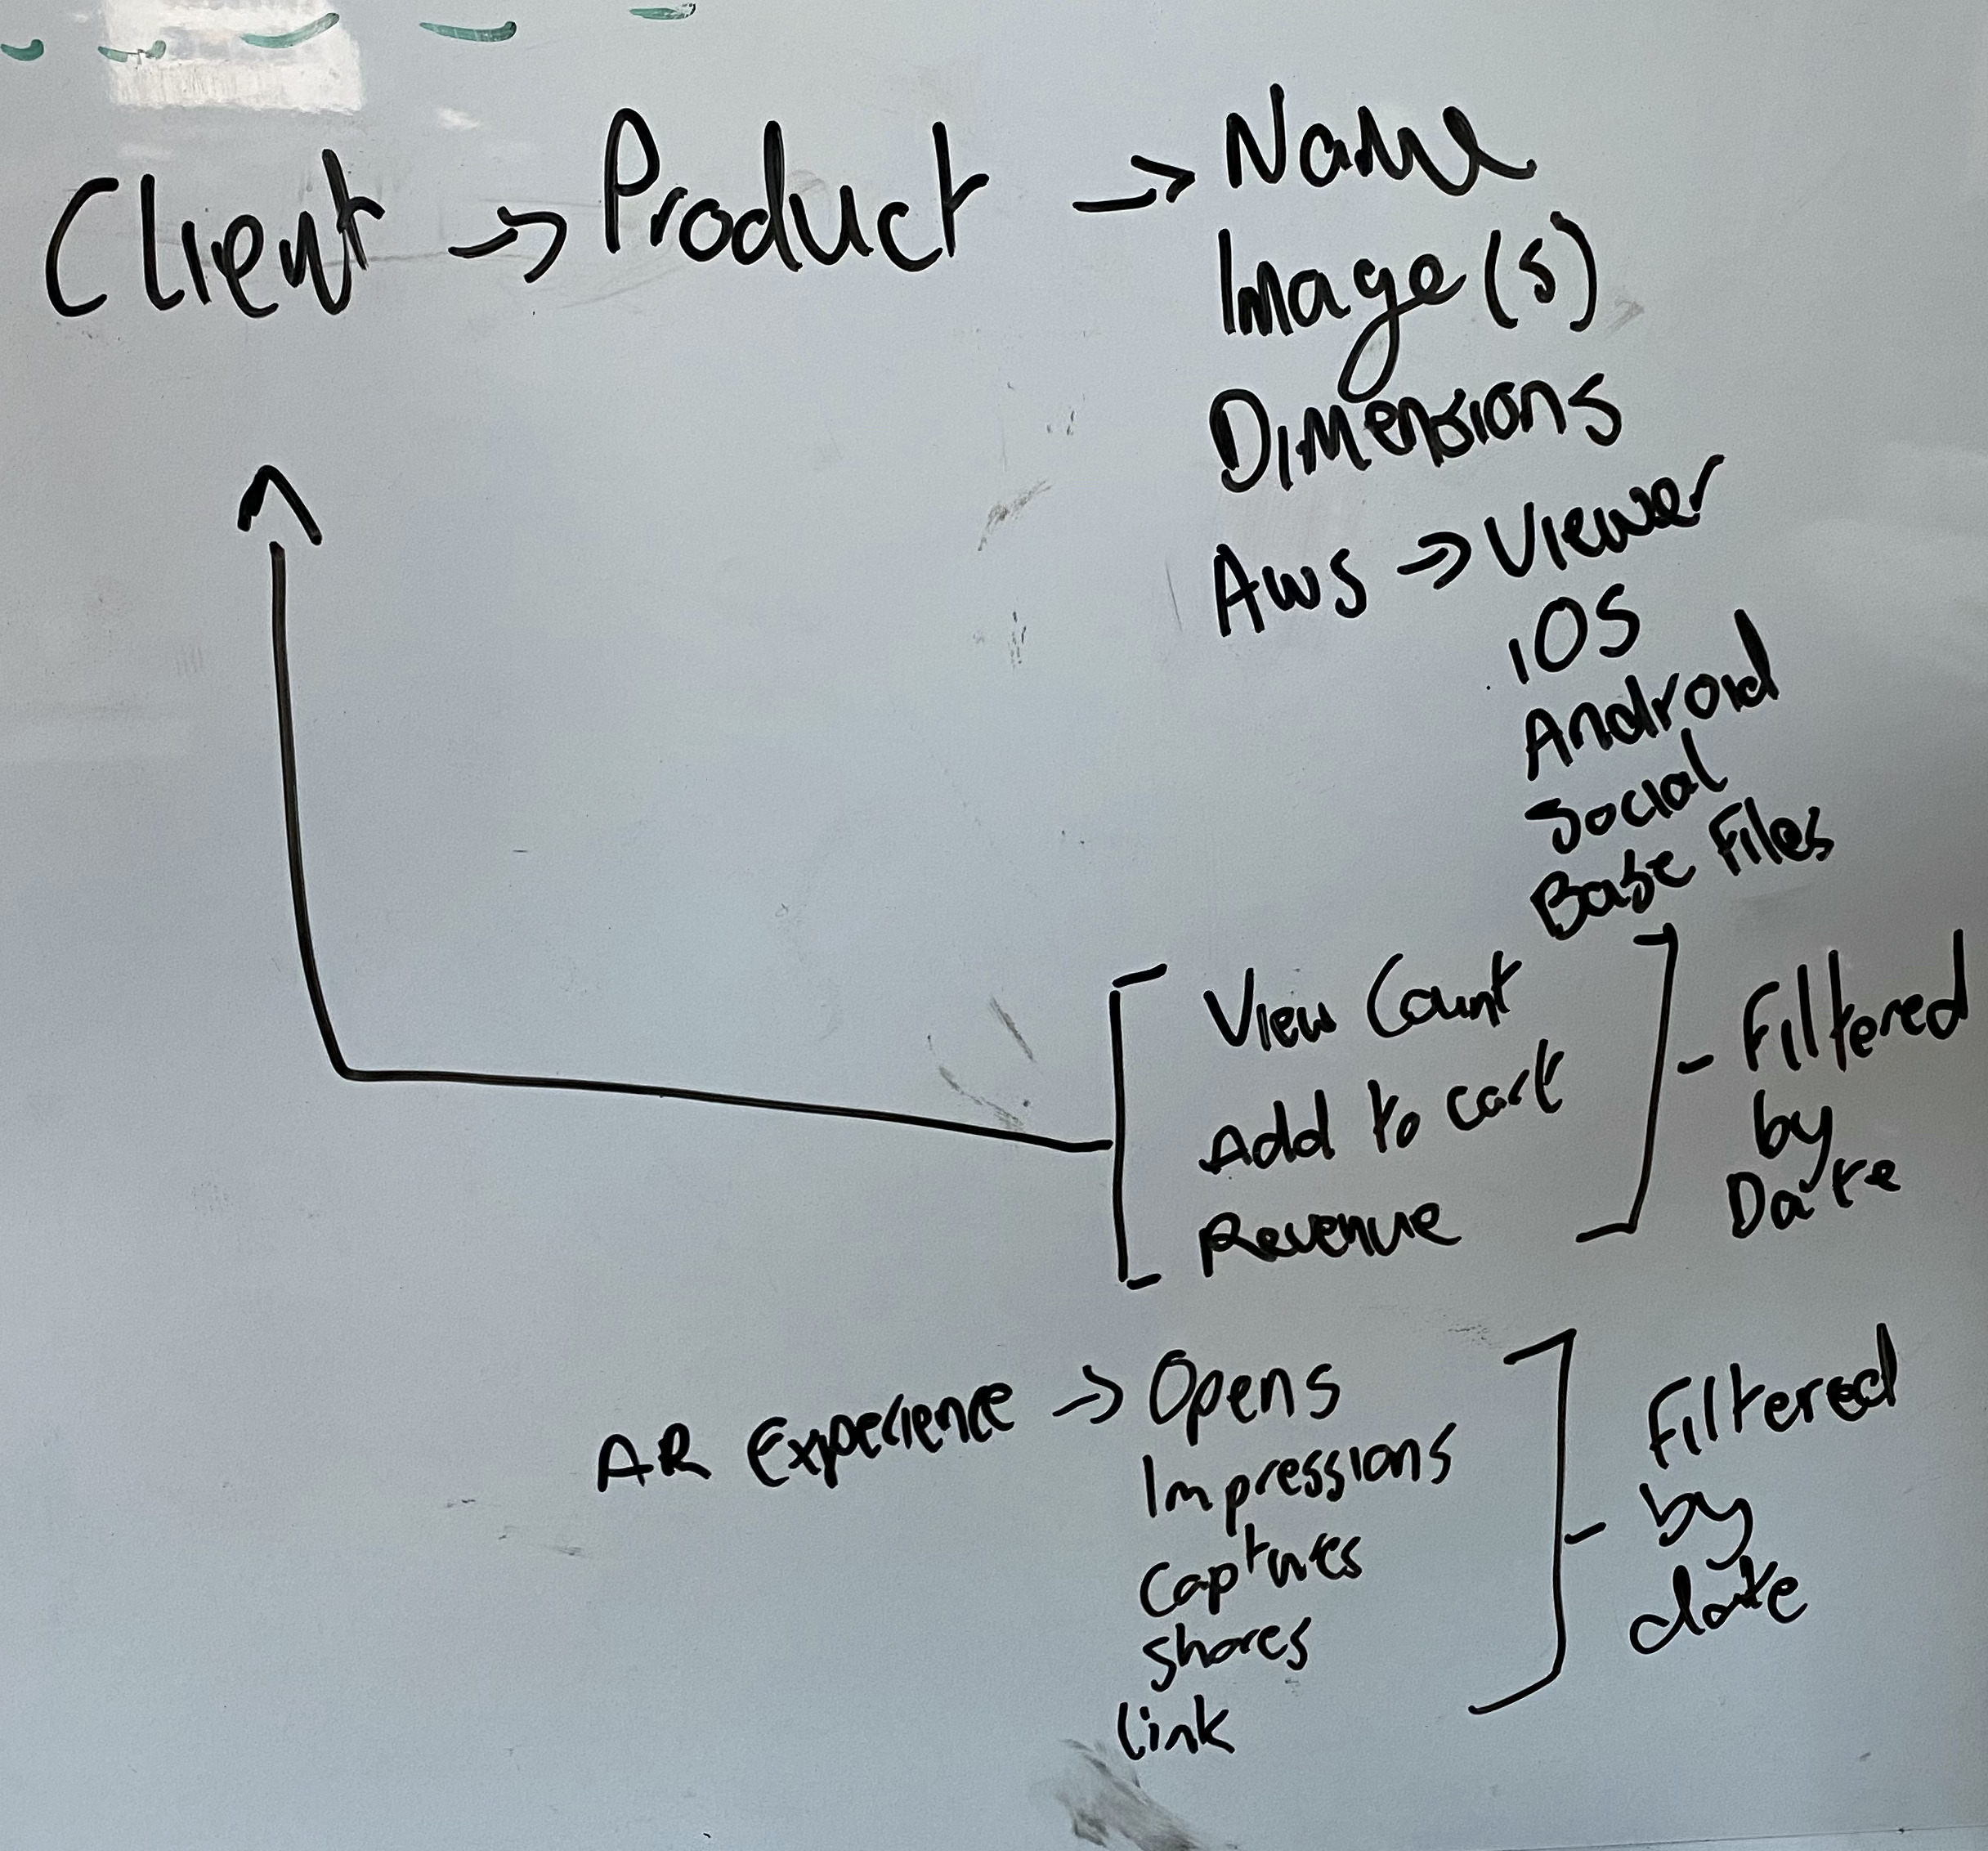
I the graph above I have outlined a rough schematic on what we are aiming to achieve however we are running into issues with tracking on a daily basis.

I’m not sure how to structure our base so that we can gain the ability filter by day, see which products were trending, measure performance based on view count and feed that back to the client’s tag.

Ideally we want to enable our clients to change a date field and see the product list re-order as such, with views, revenue etc following.

We can populate the records via an API, we are just struggling with the base design.

875FFF34-9DFC-4407-8664-242B9497AA33_1_201_a

5 Replies 5

I don’t want to toss cold water on your plan, but this is likely a bad fit for Airtable.

Log analytics are typically vast in quantity and tend to be like a firehose. Airtable is not well-suited for either large record quantities or rapid flows of data.

As your requirements make clear, log analytics need agile slicing features that are simply not easily achieved in Airtable. You need time-slicing abilities like this (I suspect) -

image

You also need comprehensive data visualization like this (I suspect) -

image

If you must do this in Airtable, consider these ideas.

  1. Look closely at Vega-Lite (in addition to of the Charts App).
  2. Look at ways to aggregate log records as collections of objects in single [aggregate] Airtable records.

Hey Bill,

Thanks so much for the detailed answer. You’re likely right, sadly, as I love Airtable.

A few points that may adjust your answer and apologies for not including more info.

We are pushing this info externally to Webflow using integromat and graphing there behind client logins.

Time slicing is the big puzzler for me and what’s catching us out in the base design.

We are willing to aggregate the logs into a single line, one record for each client each day for example.

Not sure how to time slice or count the total amount of products viewed in a given time range.

Even having fields on This month, last month, 2 months ago, 3 months ago, etc (that we can replace in our charts) would be adequate.

Am I still barking up the wrong tree? Or should I have another whack at the base design with this in mind?

Yep, this is known as time-series data and very few database systems handle this well or effortlessly. My experience is to put time-series data into something designed for log data — like ElasticSearch — and then extract analytics from that log store and/or extract raw data into whatever platform that you want to craft the analytics.

The extract part is the challenge because you need queries that magically understand relative time-points such as …

  • Now - 1d to Now
  • Now - 1w to Now
  • Now - 1m to Now

… and a whole host of other date computations in the context of the query process.

This is a difficult question to help you answer since there’s little I know about the data you’re trying to log or the pace/volume you need to scale to. As a code-monkey, I always lean toward “another whack” but that’s just me, my hubris, and a positive attitude that I can pretty much make anything work - even woefully impractical things.

Hey Bill,

Thanks for you insights and help. I’ve rebuilt our base with presets for time series data and our developer is populating these records using BigQuery and a few other pieces. If we need to we can move our graphing etc to google data studio if we ever outgrow this workflow.

Appreciate your detailed responses and input ❤️

Allen