Help

Re: Vega-Lite line graph same data, two visualizations

Solved
Jump to Solution
749 0
cancel
Showing results for 
Search instead for 
Did you mean: 
Patrick-Kennedy
7 - App Architect
7 - App Architect

Hello,
Any idea how I would transform monthly totals into a cumulative total over time?

I’ve tried using an aggregate transform (presumably a count operator is what would do the trick?), but it keeps telling me wherever I insert it that is doesn’t belong :neutral_face:

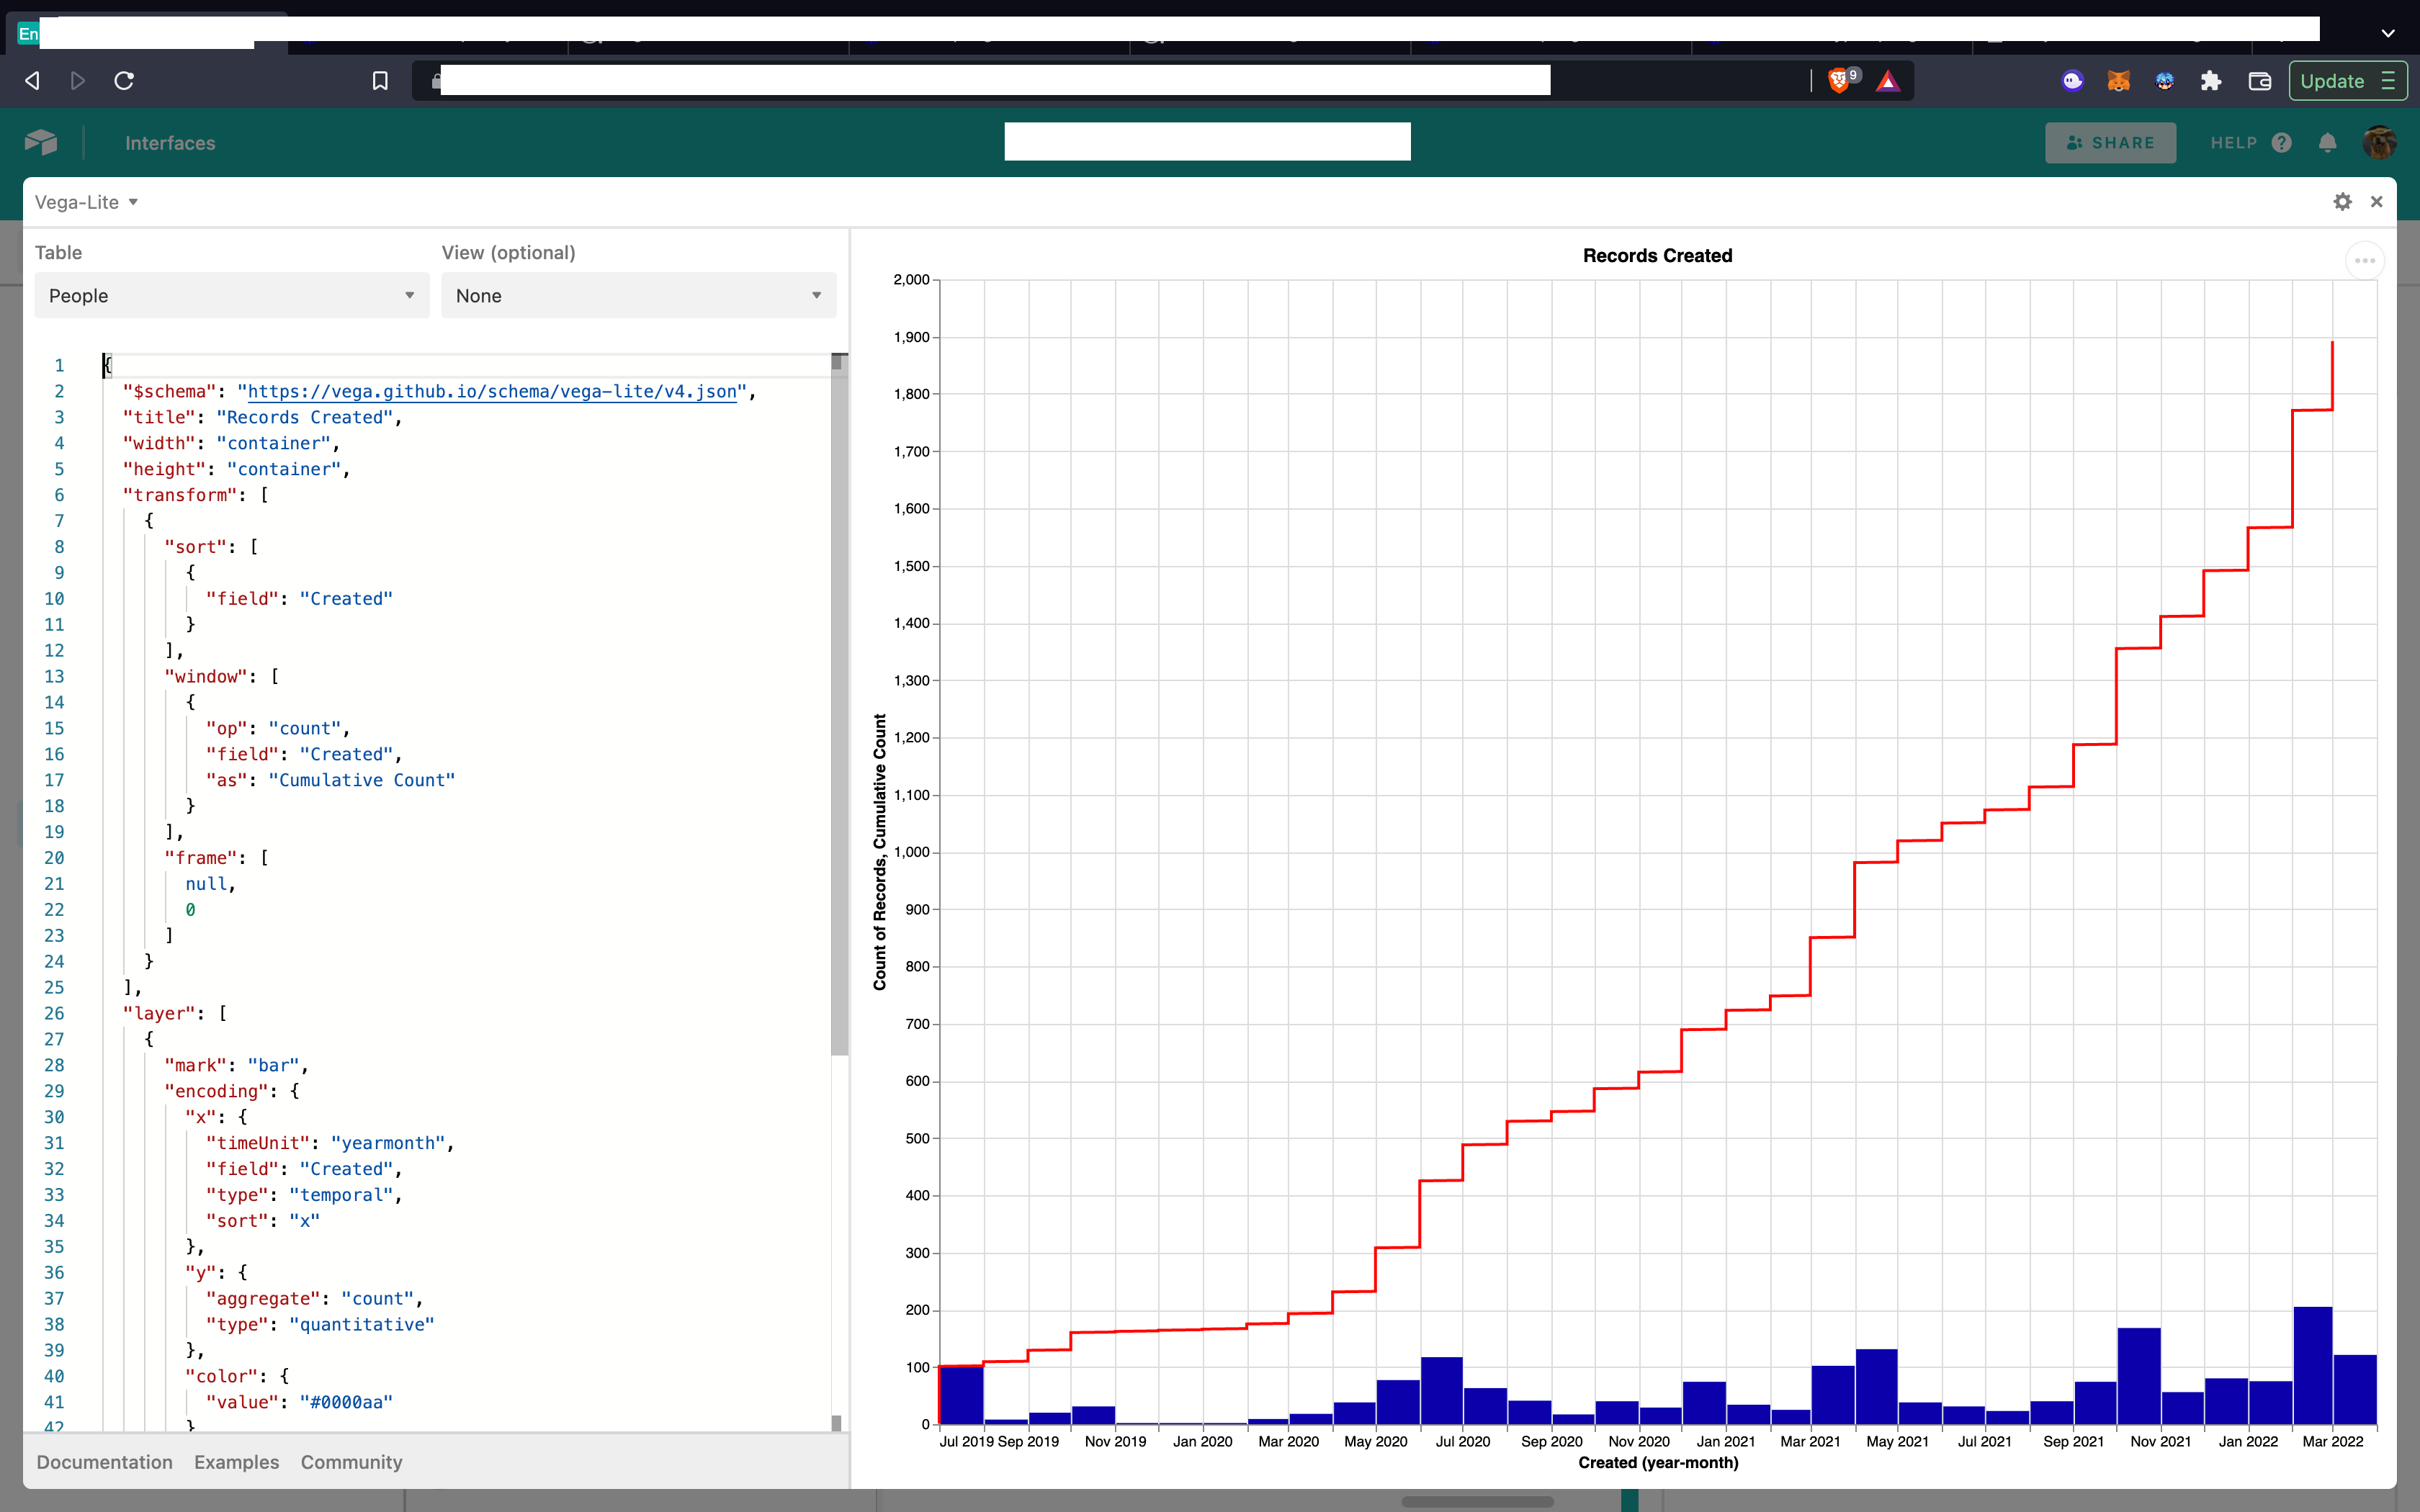
Basically, I would like to show two different versions of the same data; displaying the number of records created on a table over time by:

  • Total each month (bar)
  • Cumulative total over time (line)

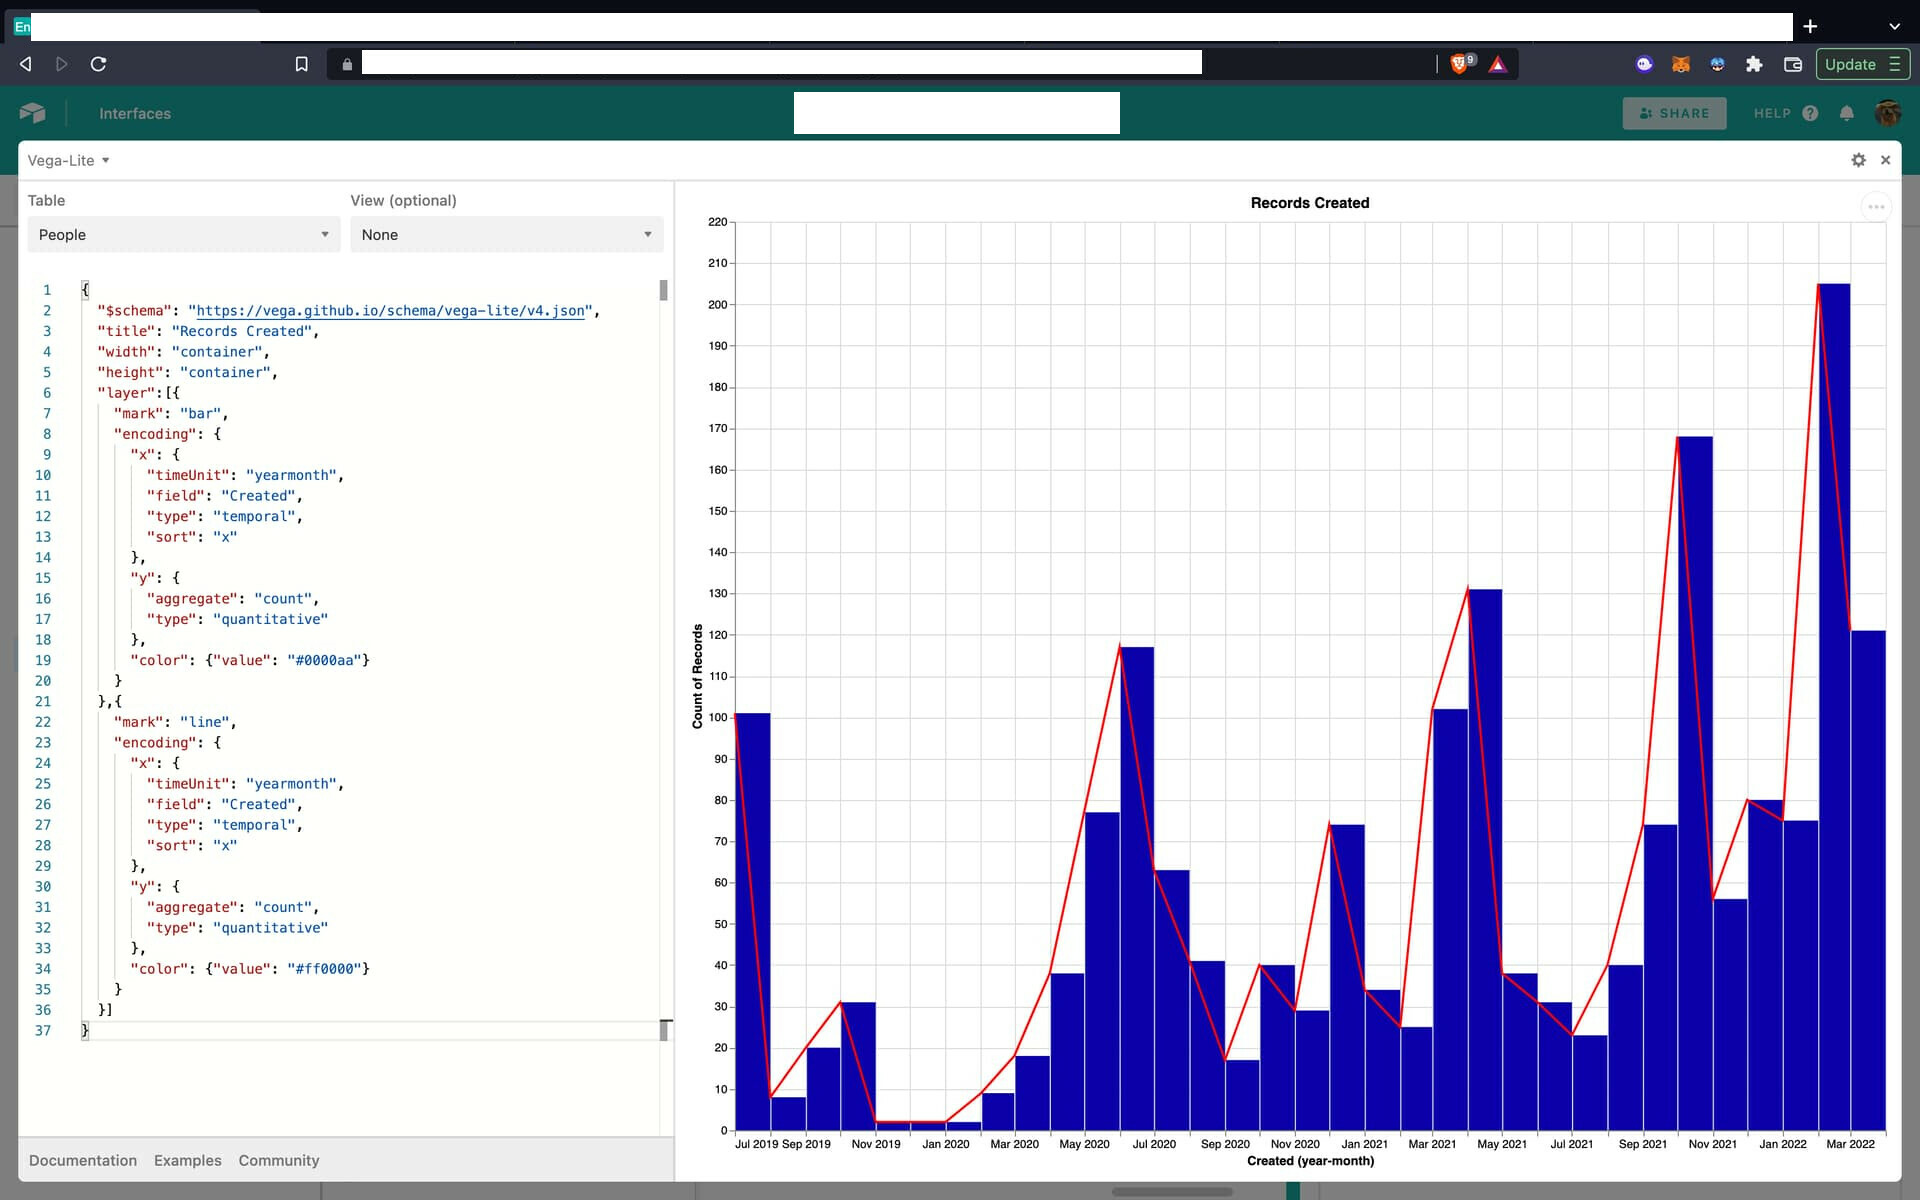
I’m able to layer a line chart and a bar chart of the month-by-month totals like so:

{
  "$schema": "https://vega.github.io/schema/vega-lite/v4.json",
  "title": "Records Created",
  "width": "container",
  "height": "container",
  "layer":[{
    "mark": "bar",
    "encoding": {
      "x": {
        "timeUnit": "yearmonth",
        "field": "Created",
        "type": "temporal",
        "sort": "x"
      },
      "y": {
        "aggregate": "count",
        "type": "quantitative"
      },
      "color": {"value": "#0000aa"}
    }
  },{
    "mark": "line",
    "encoding": {
      "x": {
        "timeUnit": "yearmonth",
        "field": "Created",
        "type": "temporal",
        "sort": "x"
      },
      "y": {
        "aggregate": "count",
        "type": "quantitative"
      },
      "color": {"value": "#ff0000"}
    } 
  }]
}

How could I factor the cumulative total as well for the line graph?

Thanks :slightly_smiling_face:

1357f0355ff9103d781c17cd911e1aedc836cf16

1 Solution

Accepted Solutions
Patrick-Kennedy
7 - App Architect
7 - App Architect

Oh, ha! I did it…

{
  "$schema": "https://vega.github.io/schema/vega-lite/v4.json",
  "title": "Records Created",
  "width": "container",
  "height": "container",
  "transform": [
    {
      "sort": [
        {
          "field": "Created"
        }
      ],
      "window": [
        {
          "op": "count",
          "field": "Created",
          "as": "Cumulative Count"
        }
      ],
      "frame": [
        null,
        0
      ]
    }
  ],
  "layer": [
    {
      "mark": "bar",
      "encoding": {
        "x": {
          "timeUnit": "yearmonth",
          "field": "Created",
          "type": "temporal",
          "sort": "x"
        },
        "y": {
          "aggregate": "count",
          "type": "quantitative"
        },
        "color": {
          "value": "#0000aa"
        }
      }
    },
    {
      "mark": "line",
      "encoding": {
        "x": {
          "timeUnit": "yearmonth",
          "field": "Created",
          "type": "temporal",
          "sort": "x"
        },
        "y": {
          "field": "Cumulative Count",
          "type": "quantitative"
        },
        "color": {
          "value": "#ff0000"
        }
      }
    }
  ]
}

credit where credit is due though - thanks to this example: Cumulative Frequency Distribution | Vega-Lite …I still do not at all understand Vega-Lite syntax / modeling / data structures… but can haz win for nau!

15797995471696765f1633adae324606e8535614

See Solution in Thread

1 Reply 1
Patrick-Kennedy
7 - App Architect
7 - App Architect

Oh, ha! I did it…

{
  "$schema": "https://vega.github.io/schema/vega-lite/v4.json",
  "title": "Records Created",
  "width": "container",
  "height": "container",
  "transform": [
    {
      "sort": [
        {
          "field": "Created"
        }
      ],
      "window": [
        {
          "op": "count",
          "field": "Created",
          "as": "Cumulative Count"
        }
      ],
      "frame": [
        null,
        0
      ]
    }
  ],
  "layer": [
    {
      "mark": "bar",
      "encoding": {
        "x": {
          "timeUnit": "yearmonth",
          "field": "Created",
          "type": "temporal",
          "sort": "x"
        },
        "y": {
          "aggregate": "count",
          "type": "quantitative"
        },
        "color": {
          "value": "#0000aa"
        }
      }
    },
    {
      "mark": "line",
      "encoding": {
        "x": {
          "timeUnit": "yearmonth",
          "field": "Created",
          "type": "temporal",
          "sort": "x"
        },
        "y": {
          "field": "Cumulative Count",
          "type": "quantitative"
        },
        "color": {
          "value": "#ff0000"
        }
      }
    }
  ]
}

credit where credit is due though - thanks to this example: Cumulative Frequency Distribution | Vega-Lite …I still do not at all understand Vega-Lite syntax / modeling / data structures… but can haz win for nau!

15797995471696765f1633adae324606e8535614