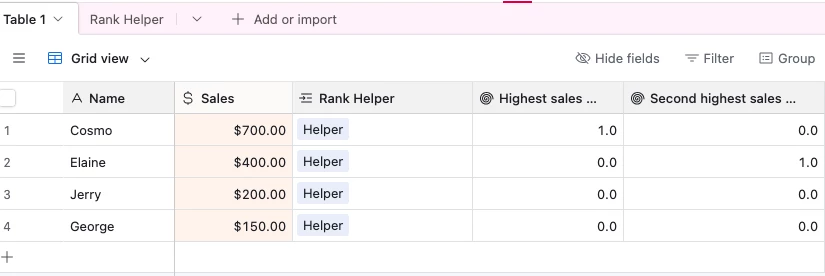
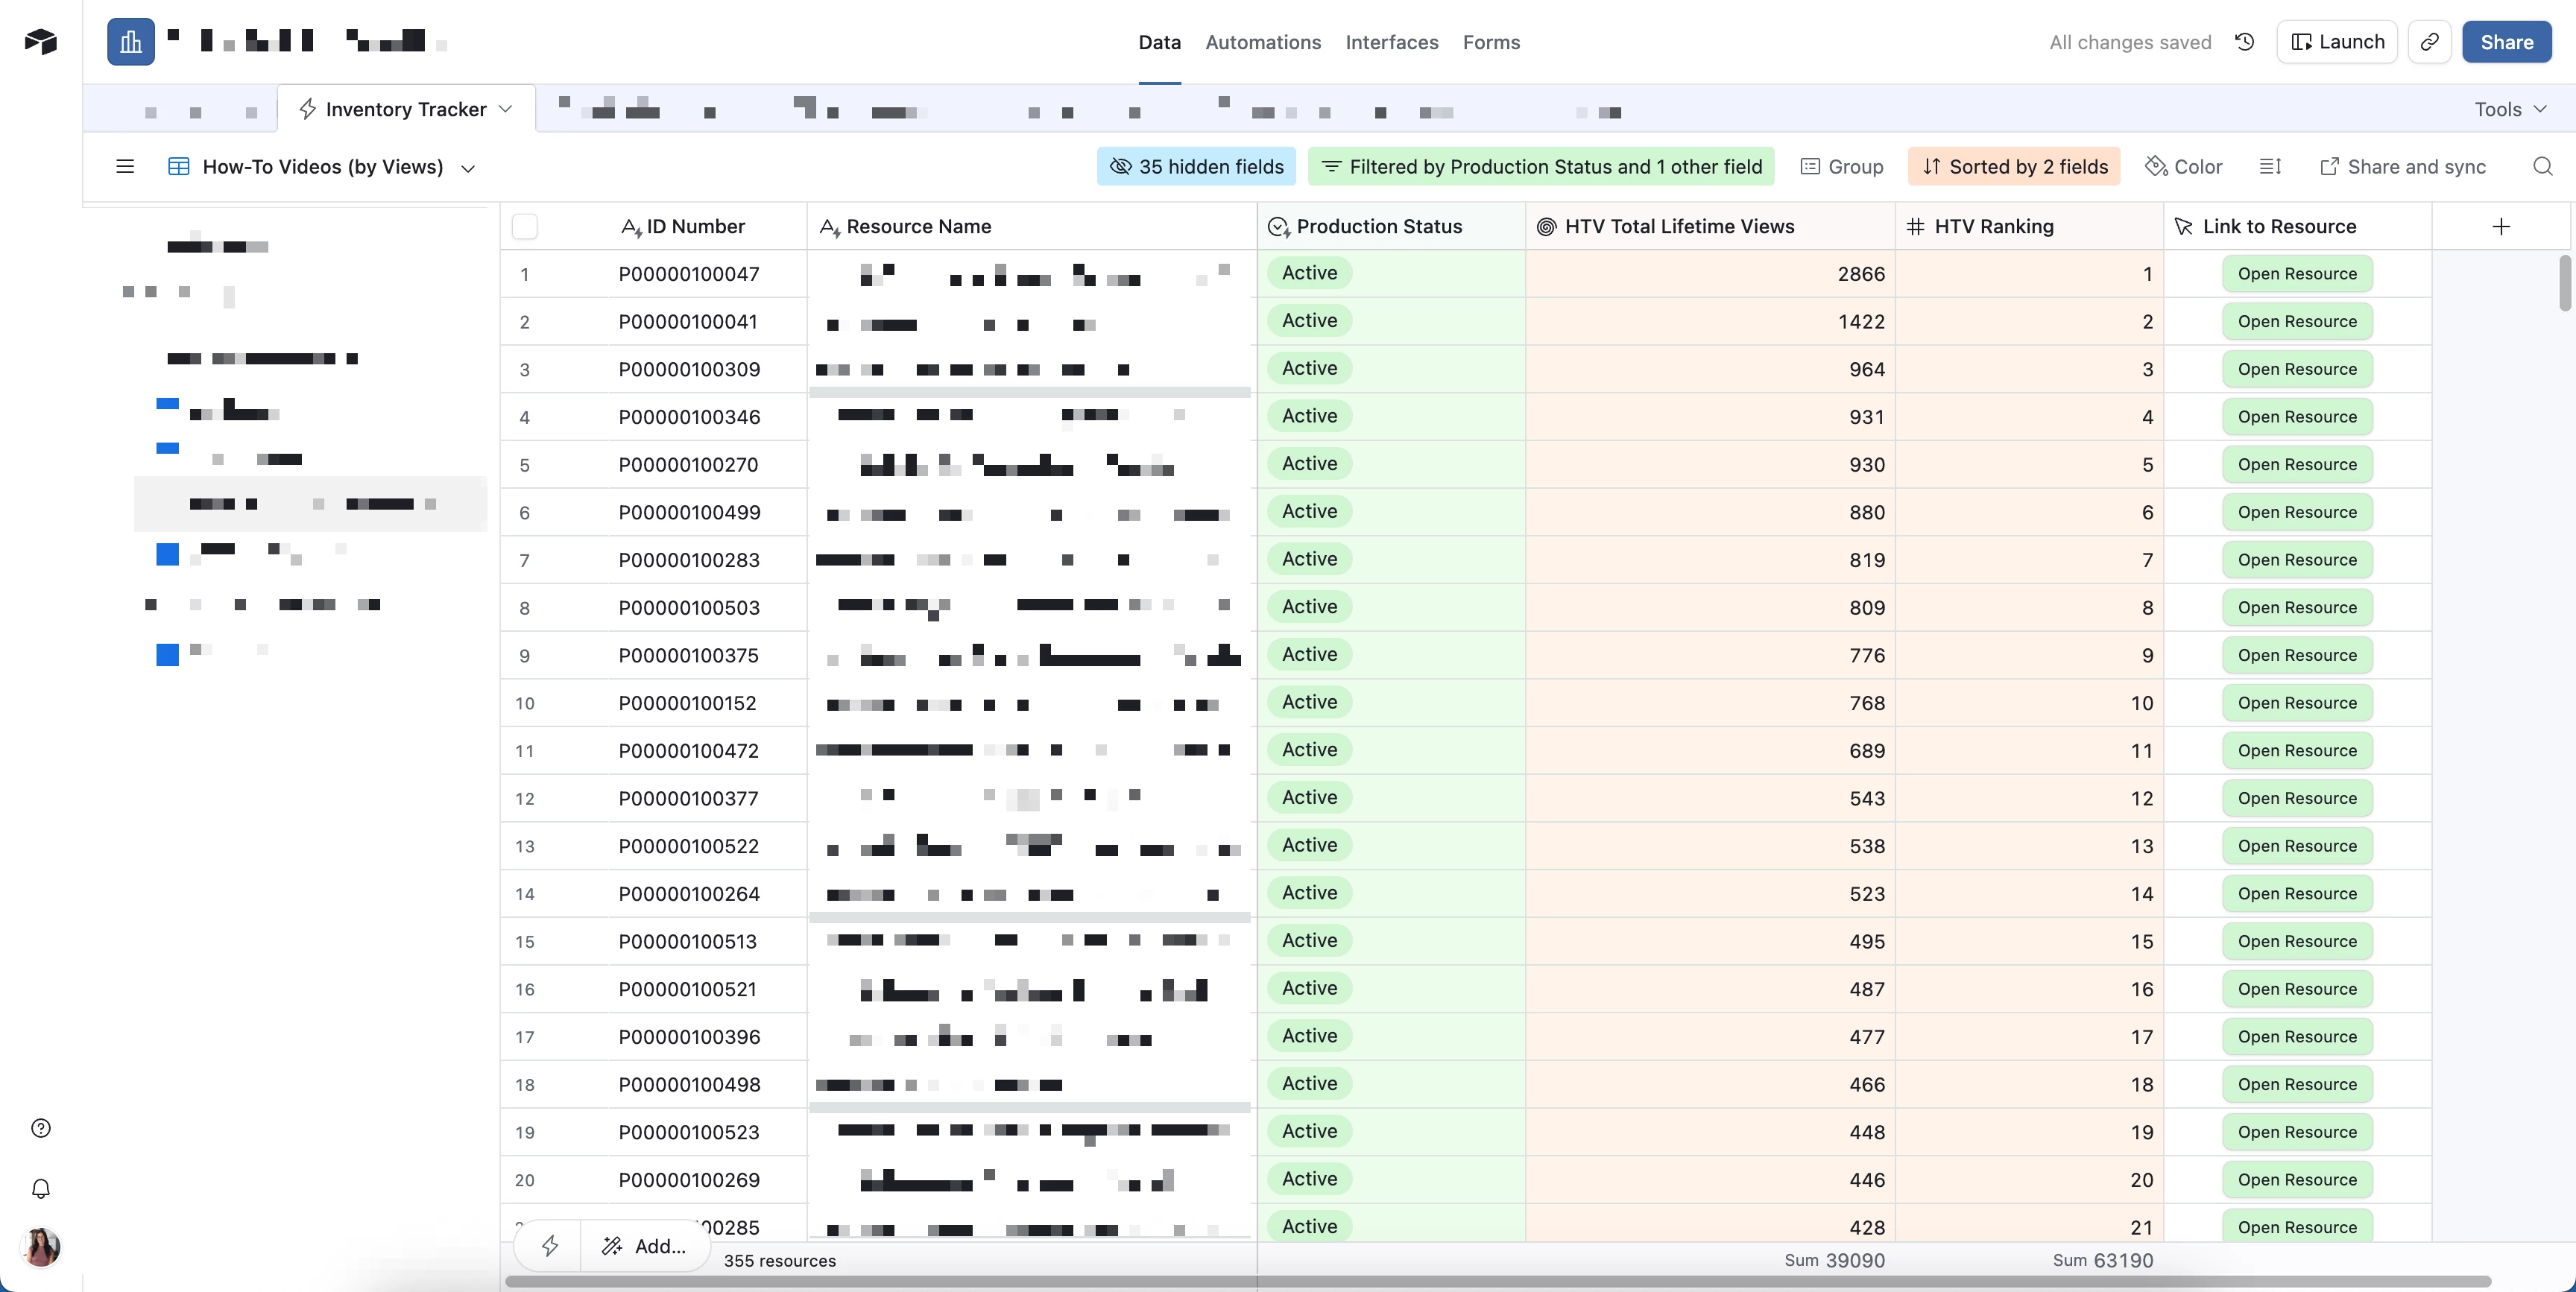
I’m making an analytics dashboard for a client. They want to be able to see the top X records by viewcount, which we track. When I make a graph for this, there’s simply too many records and the bar chart looks a mess.
I want to create a formula field that has a rank and I can include the top 5 records in a bar chart. What’s the right approach for this? I am not a developer and hoping to avoid an automation w script.