
Choosing the colors of the chart block

  • July 24, 2020
  • 3 replies
  • 70 views

Hi there !
There doesn’t seem to be a way to do it, but I thought I should ask anyway. We never know…
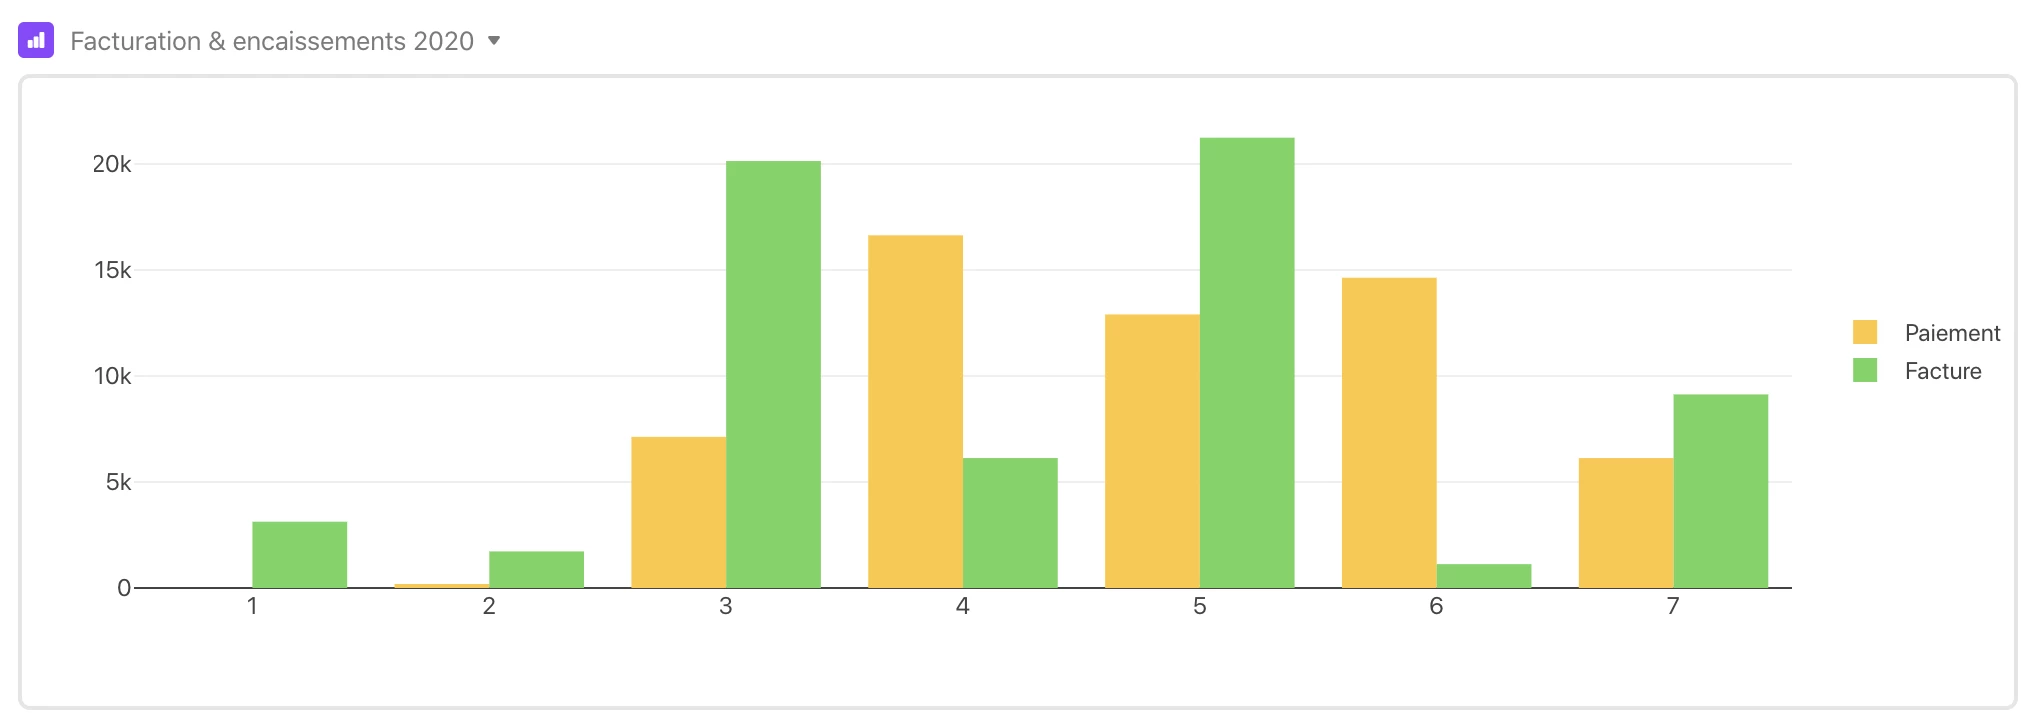
I’m color blind and those two colors choosen by airtable are about the same to me… :sob:
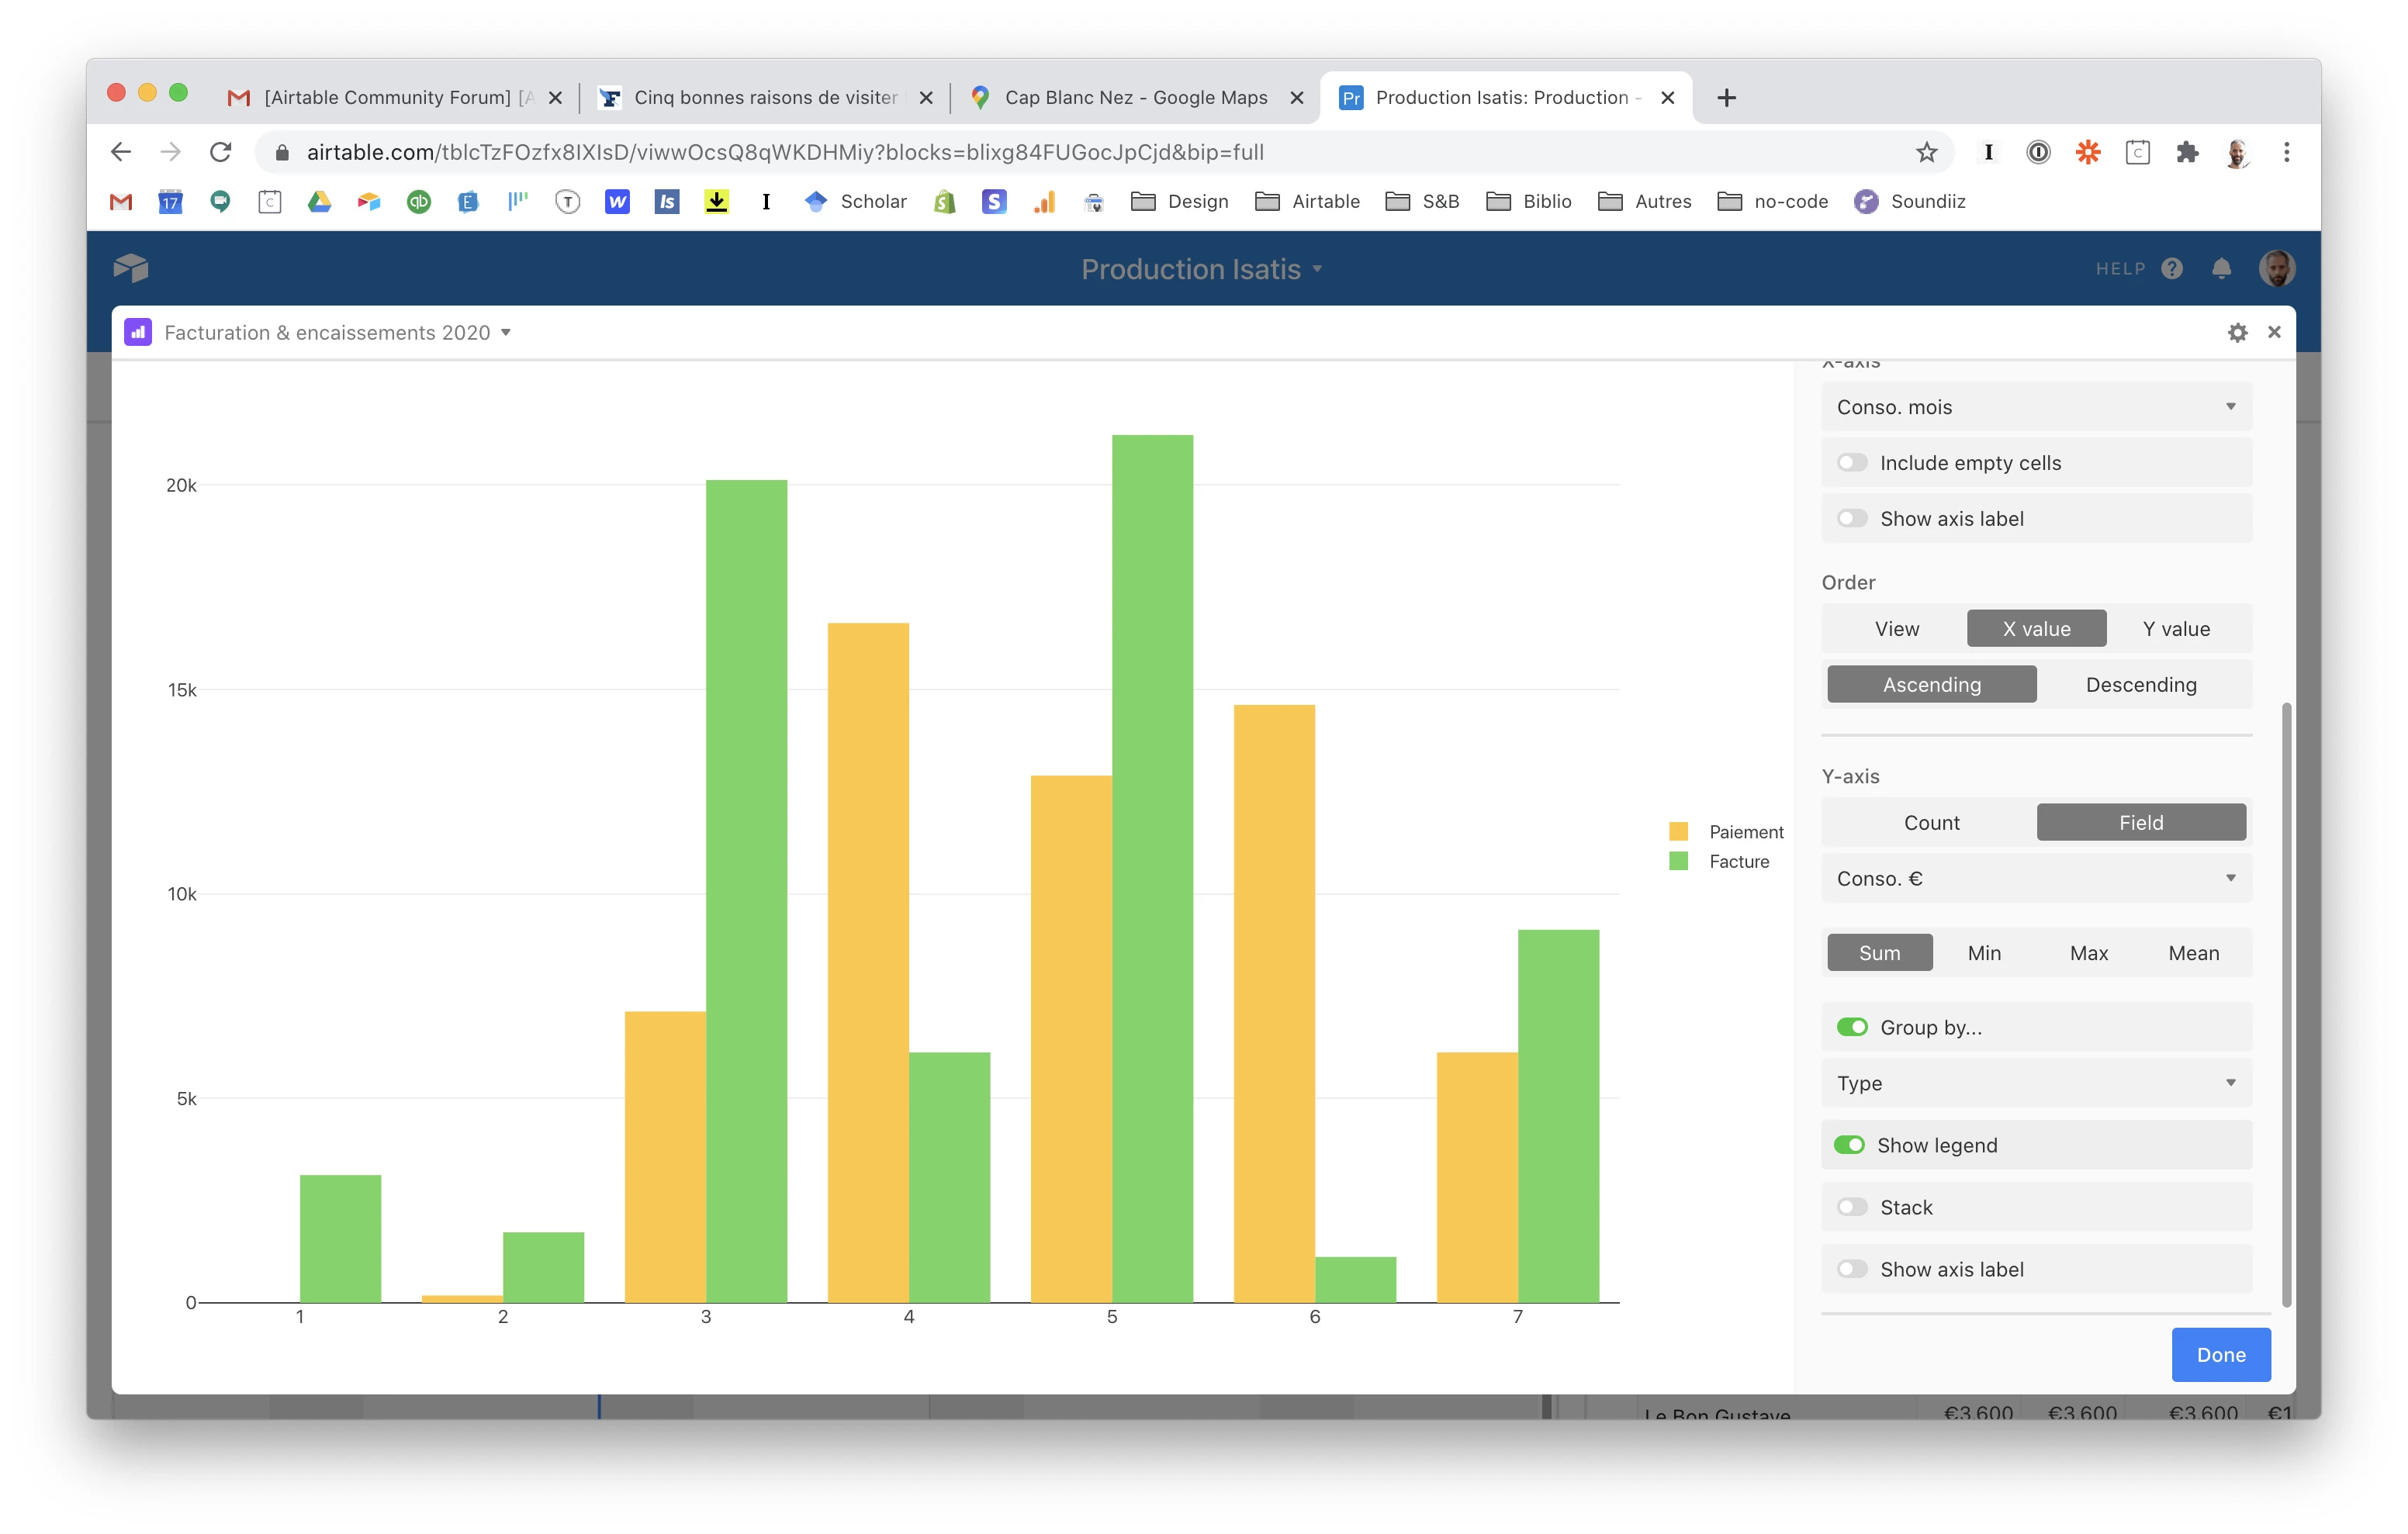
Is there any way to fix that ? I’d rather have a blue instead of one of those two colors, that would greatly help me to figure out what is what on that chart…
Thank you all by advance for your help ! :relieved:

3 replies

Justin_Barrett
Forum|alt.badge.img+21

In the upper-right corner of the chart block is a gear. Click that to open the chart settings. At the bottom you’ll see color swatches. If you don’t see those immediately, you may need to scroll the settings pane.


  • Author
  • New Participant
  • July 25, 2020

Thanks for your reply !
I can’t see the swatches, even at the bottom :face_with_monocle:


Justin_Barrett
Forum|alt.badge.img+21

Odd. In mine, it’s right below the “Show axis label” item. It looks like there’s something below that item in yours, but all that’s showing is a thin line.

Maybe add a new chart block and see if those swatches appear before setting up the rest of the block configuration.

Edit: Never mind. That thin line is the separator above the “Done” button. Still, try making a new block and see if they show up.