
I’m trying to replicate this chart Block from this example here
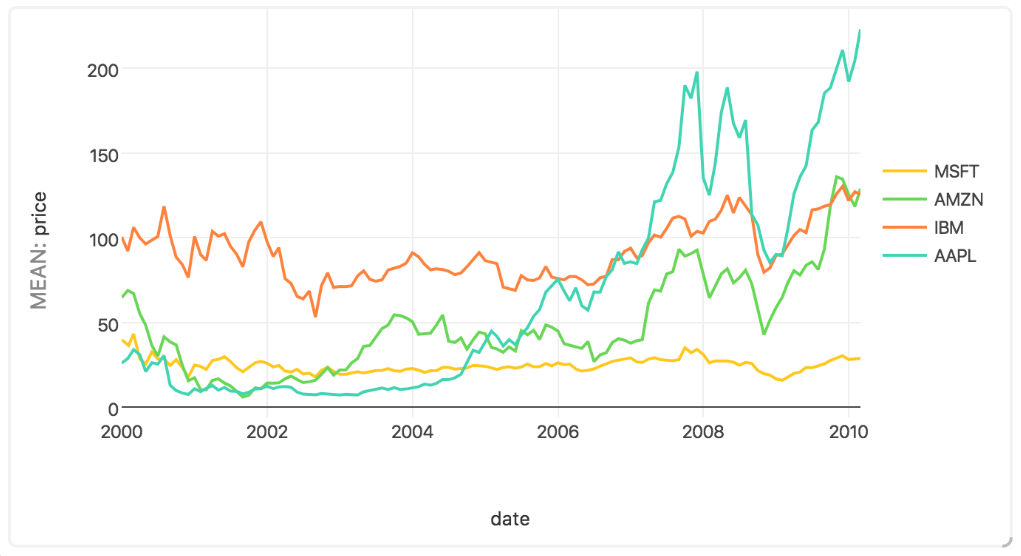
I don’t understand how this stock example was made, do they have a table containing all the stock data at different times? What would that table look like? I understand they would have a table for all the listings, but how would those listings all be linked to hundreds of price data points at different times?
Does anyone have an example of this?
