Comment Post Options
- Mark as New
- Bookmark
- Subscribe
- Subscribe to RSS Feed
- Permalink
- Report Inappropriate Content
Jun 03, 2022 06:19 PM
I’ve have a fairly broad range of data that’s been ongoing for many years now in Airtable.
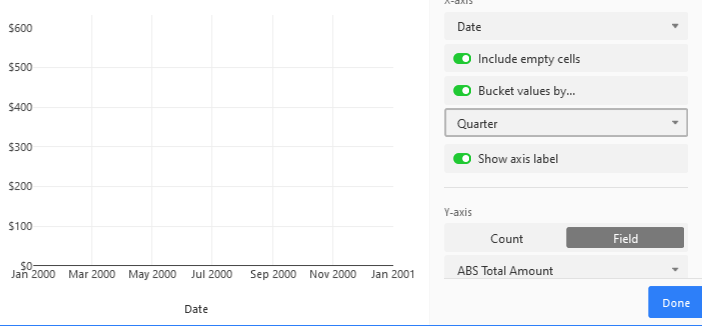
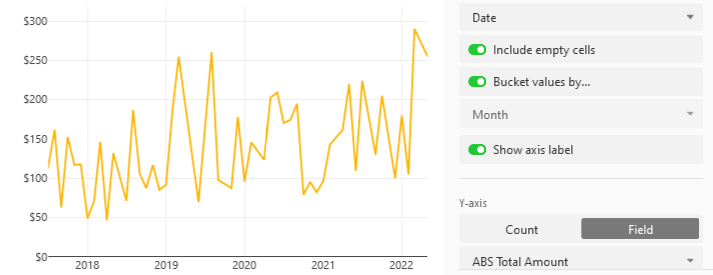
One thing I’ve always wondered however, is when I bucket working line charts (via the Chart App) into a Quarter Bucket value, the chart always draws blank. If I use either day, week, month or year, the chart fills as expected.
What am I missing here?
Month example;
Quarter example;
1 Reply 1
Comment Post Options
- Mark as New
- Bookmark
- Subscribe
- Subscribe to RSS Feed
- Permalink
- Report Inappropriate Content
Jun 04, 2022 02:07 AM
Your screenshot of your quarter bucket is showing you 22 years ago. Could be a bug… I would report it to support@airtable.com.
Reply
