Help

Product / Service Item breakdown

1018 3
cancel
Showing results for 
Search instead for 
Did you mean: 
Ben_Crouch
6 - Interface Innovator

Hi there

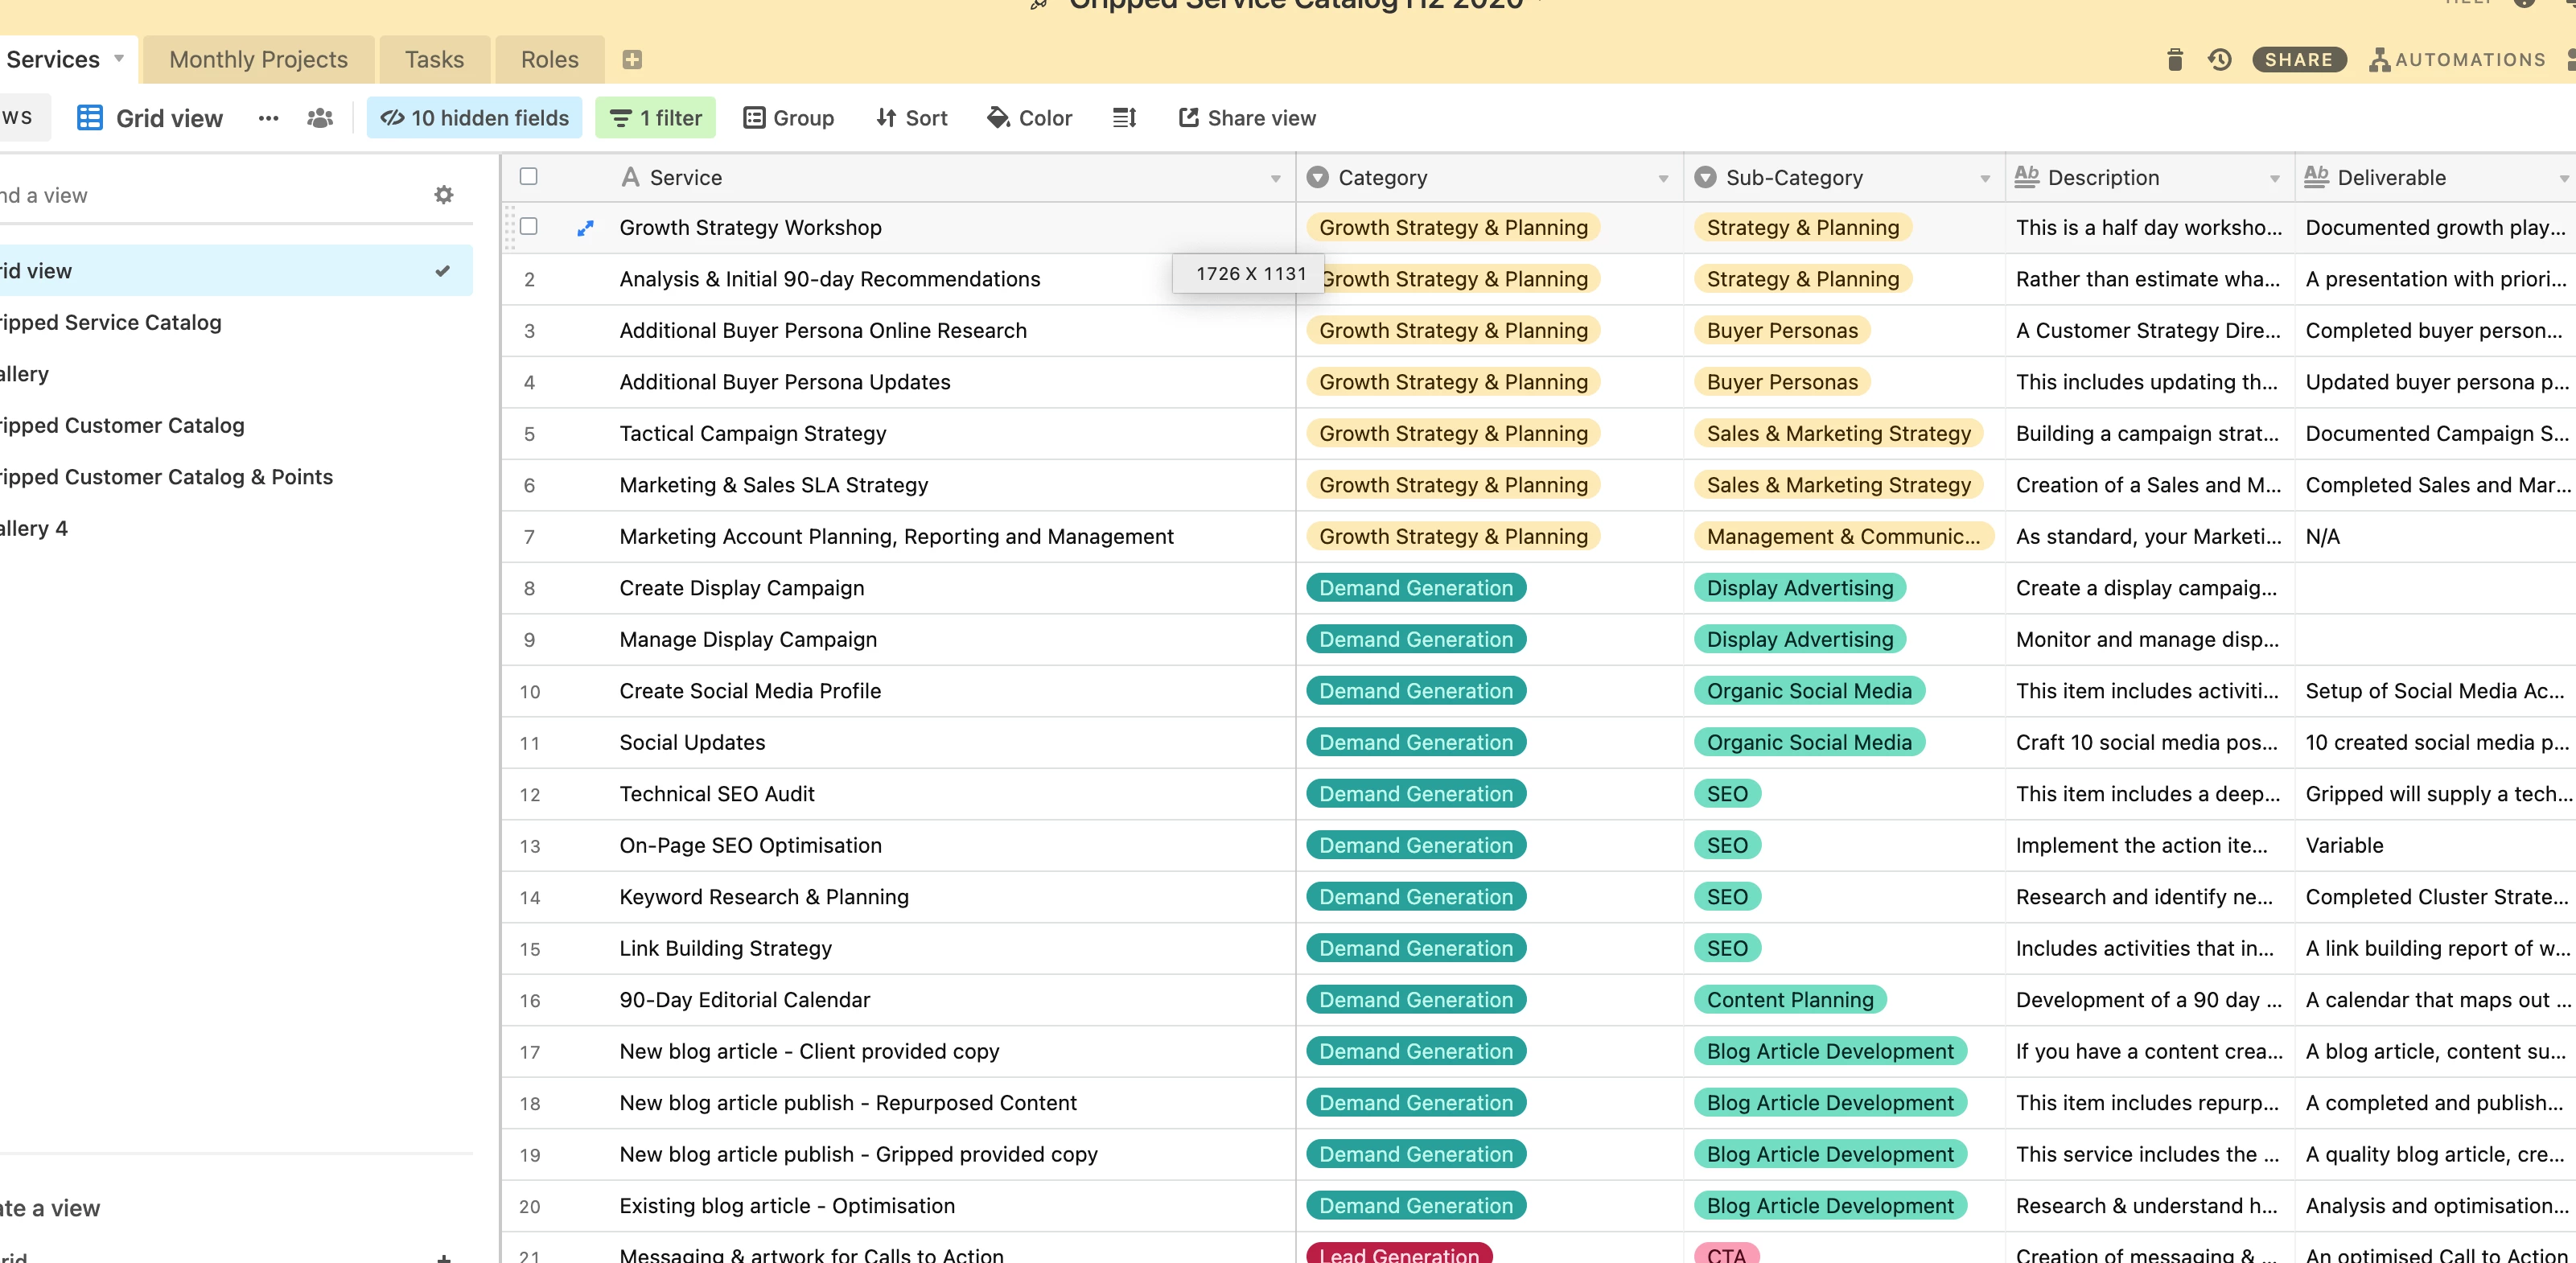
My use case is that we’re an agency and each month we deliver items from a service catalogue to deliver services for our clients. Our service catalogue is in Airtable (see below)
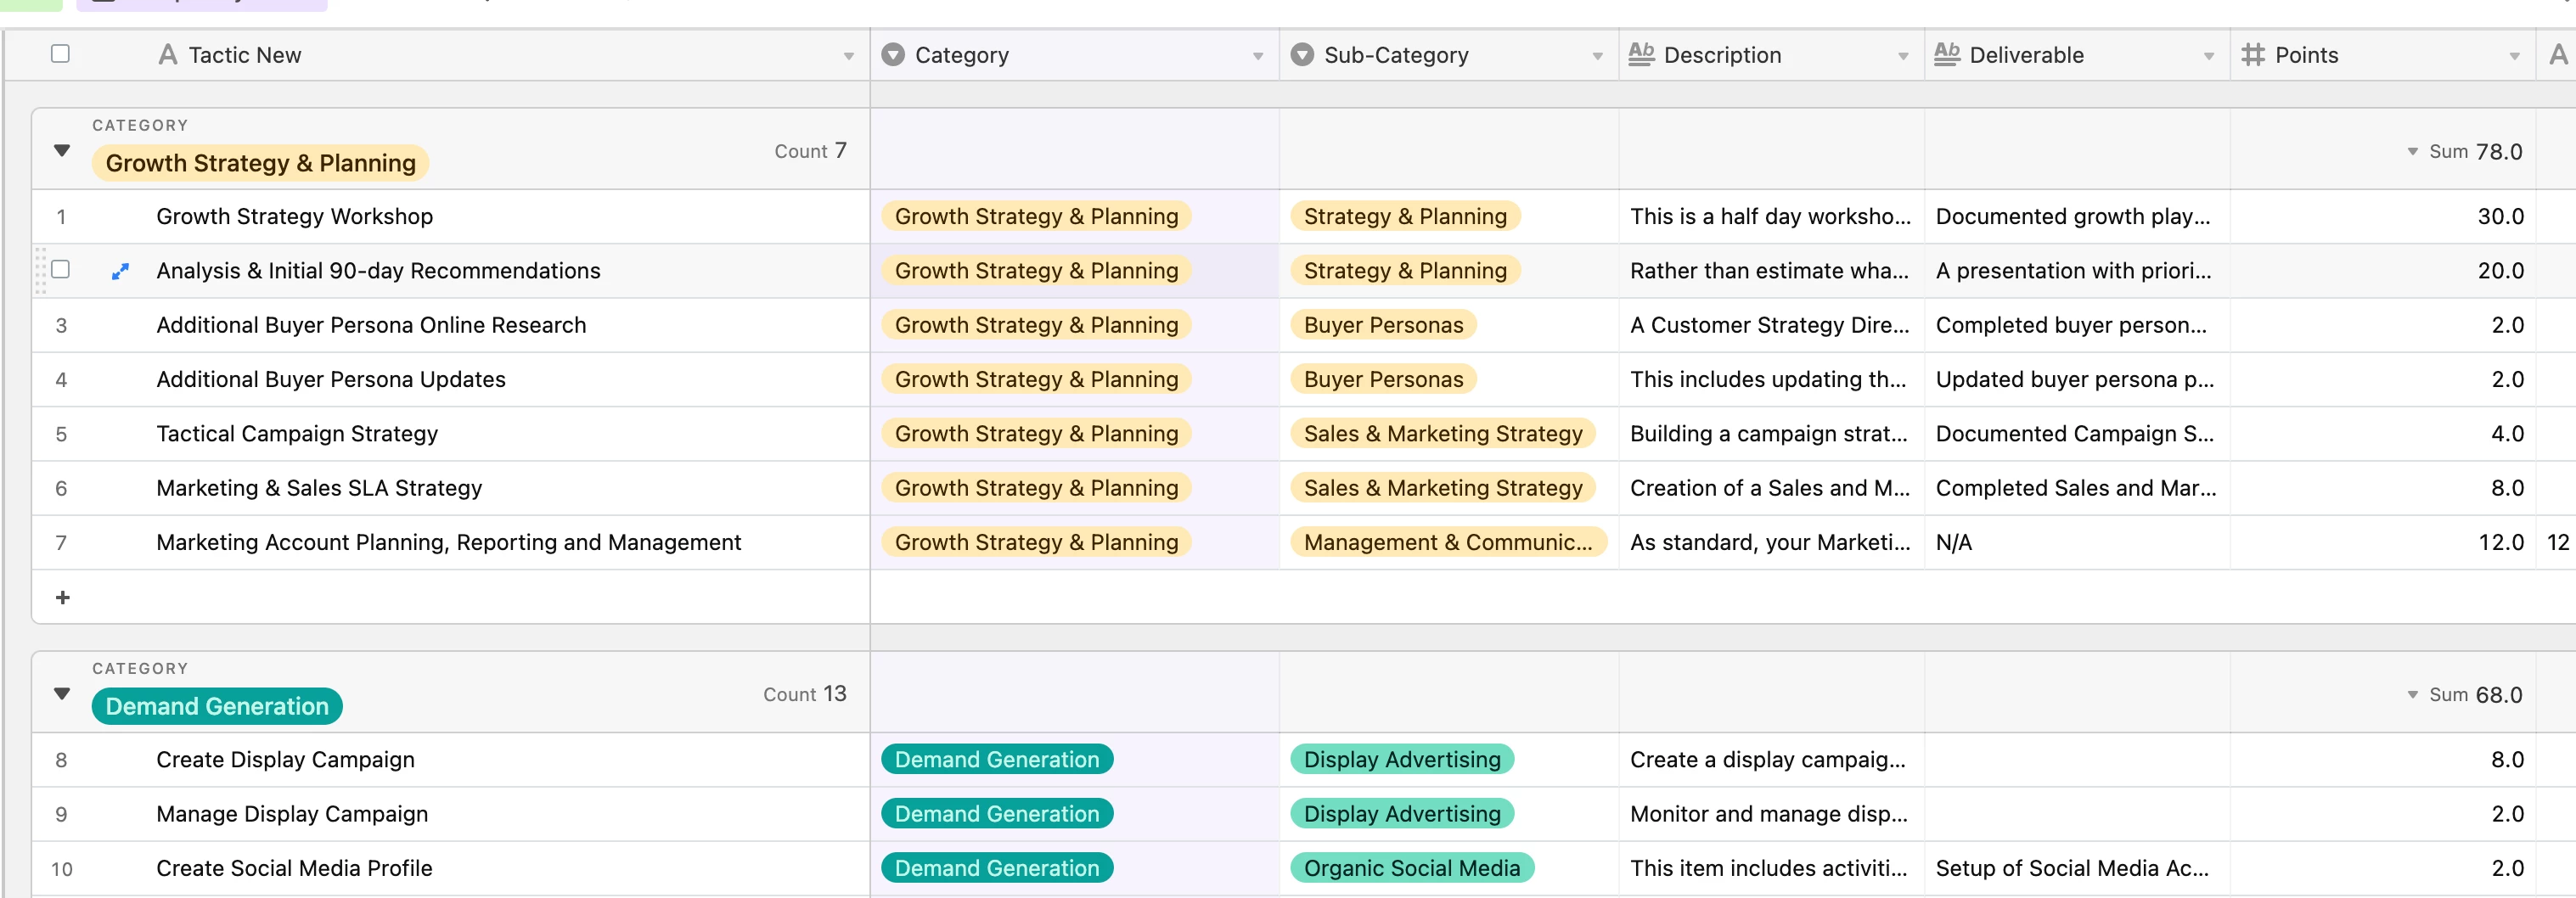
Existing Service Catalogue AT

I now want to use AT to forecast the items we are going to provide each month so I can see the number of points (think ‘hours’) we are going to deliver both at a customer & global level. I have set up a simple table to do this (see below)
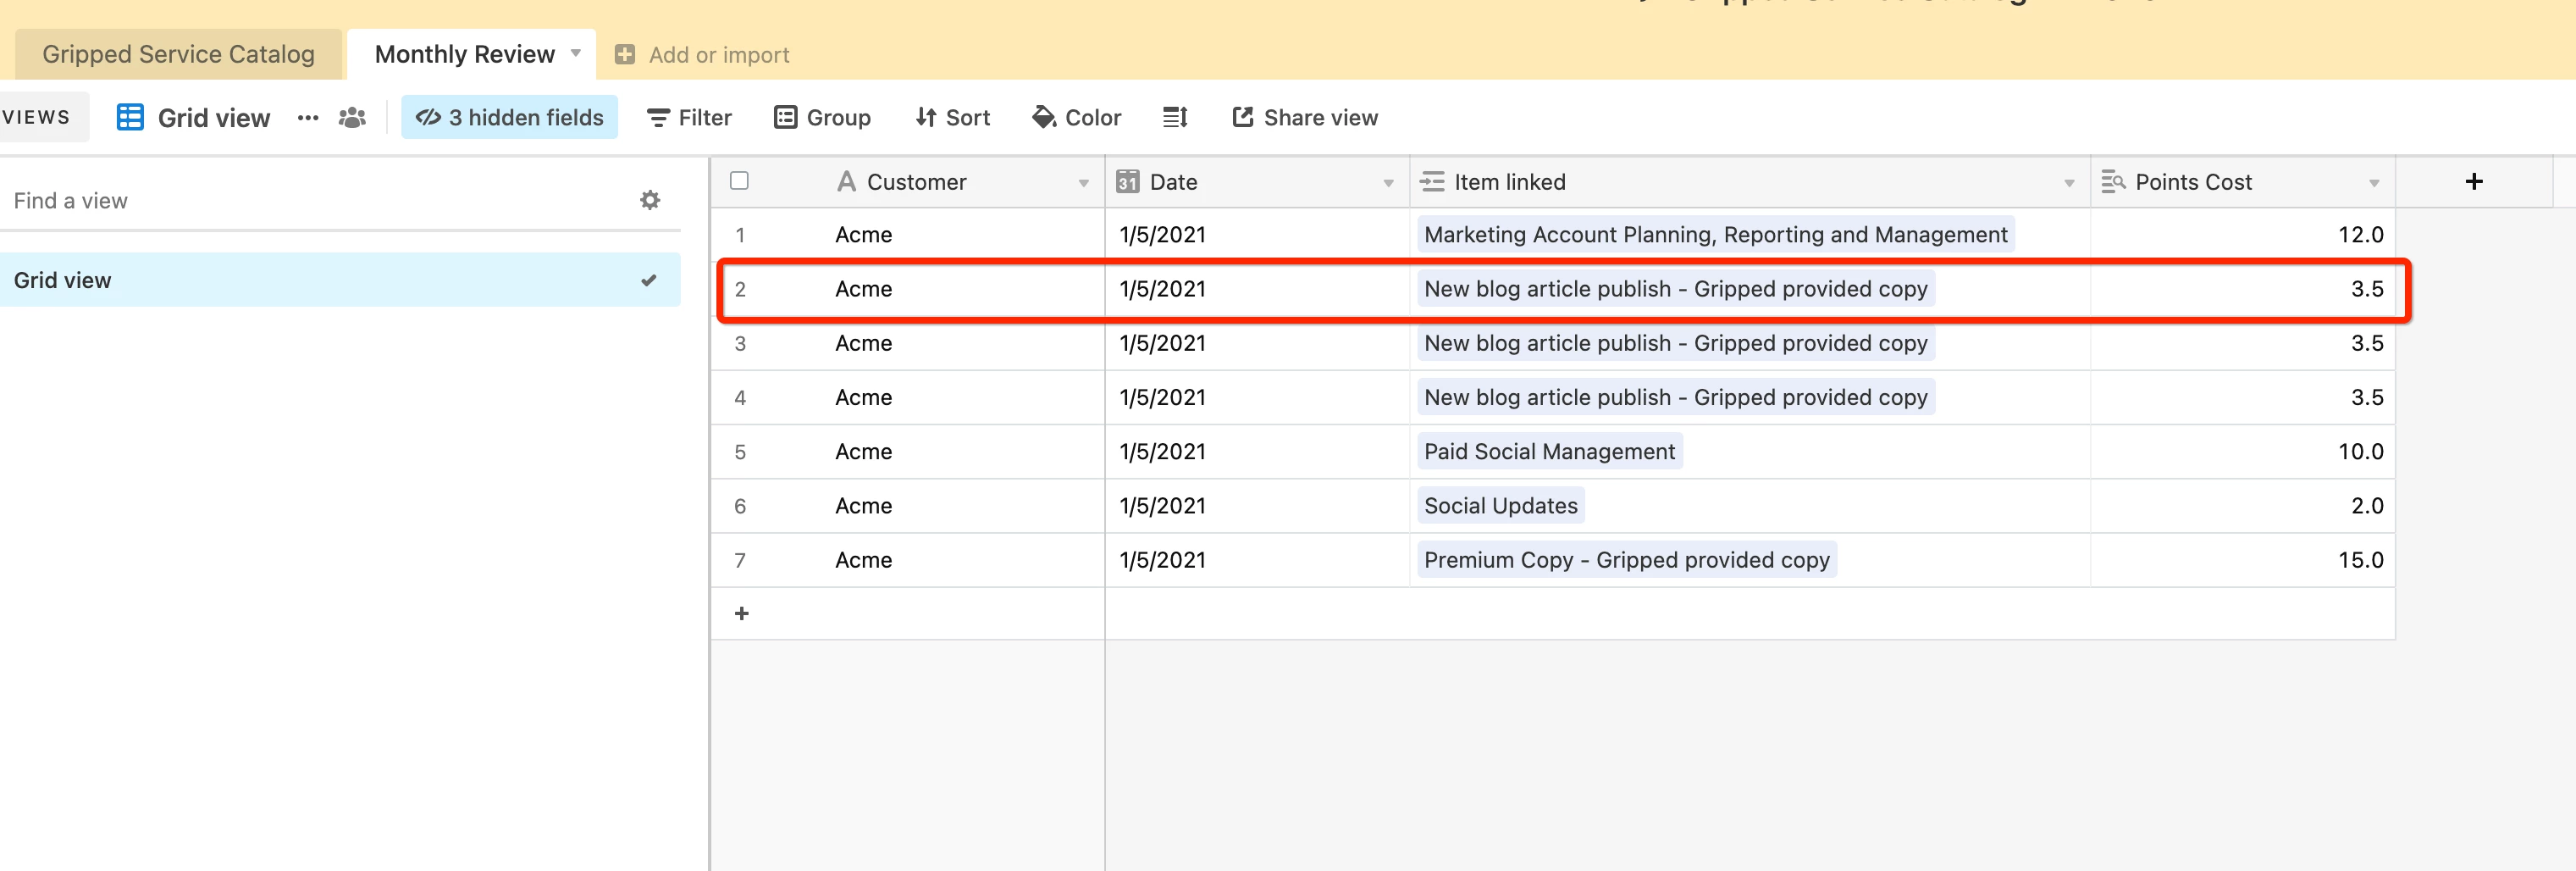
Existing Service Items per customer per month

This step is easy, however, the next level of detail I’m trying to crack is something I’m not sure how to architect in AT.

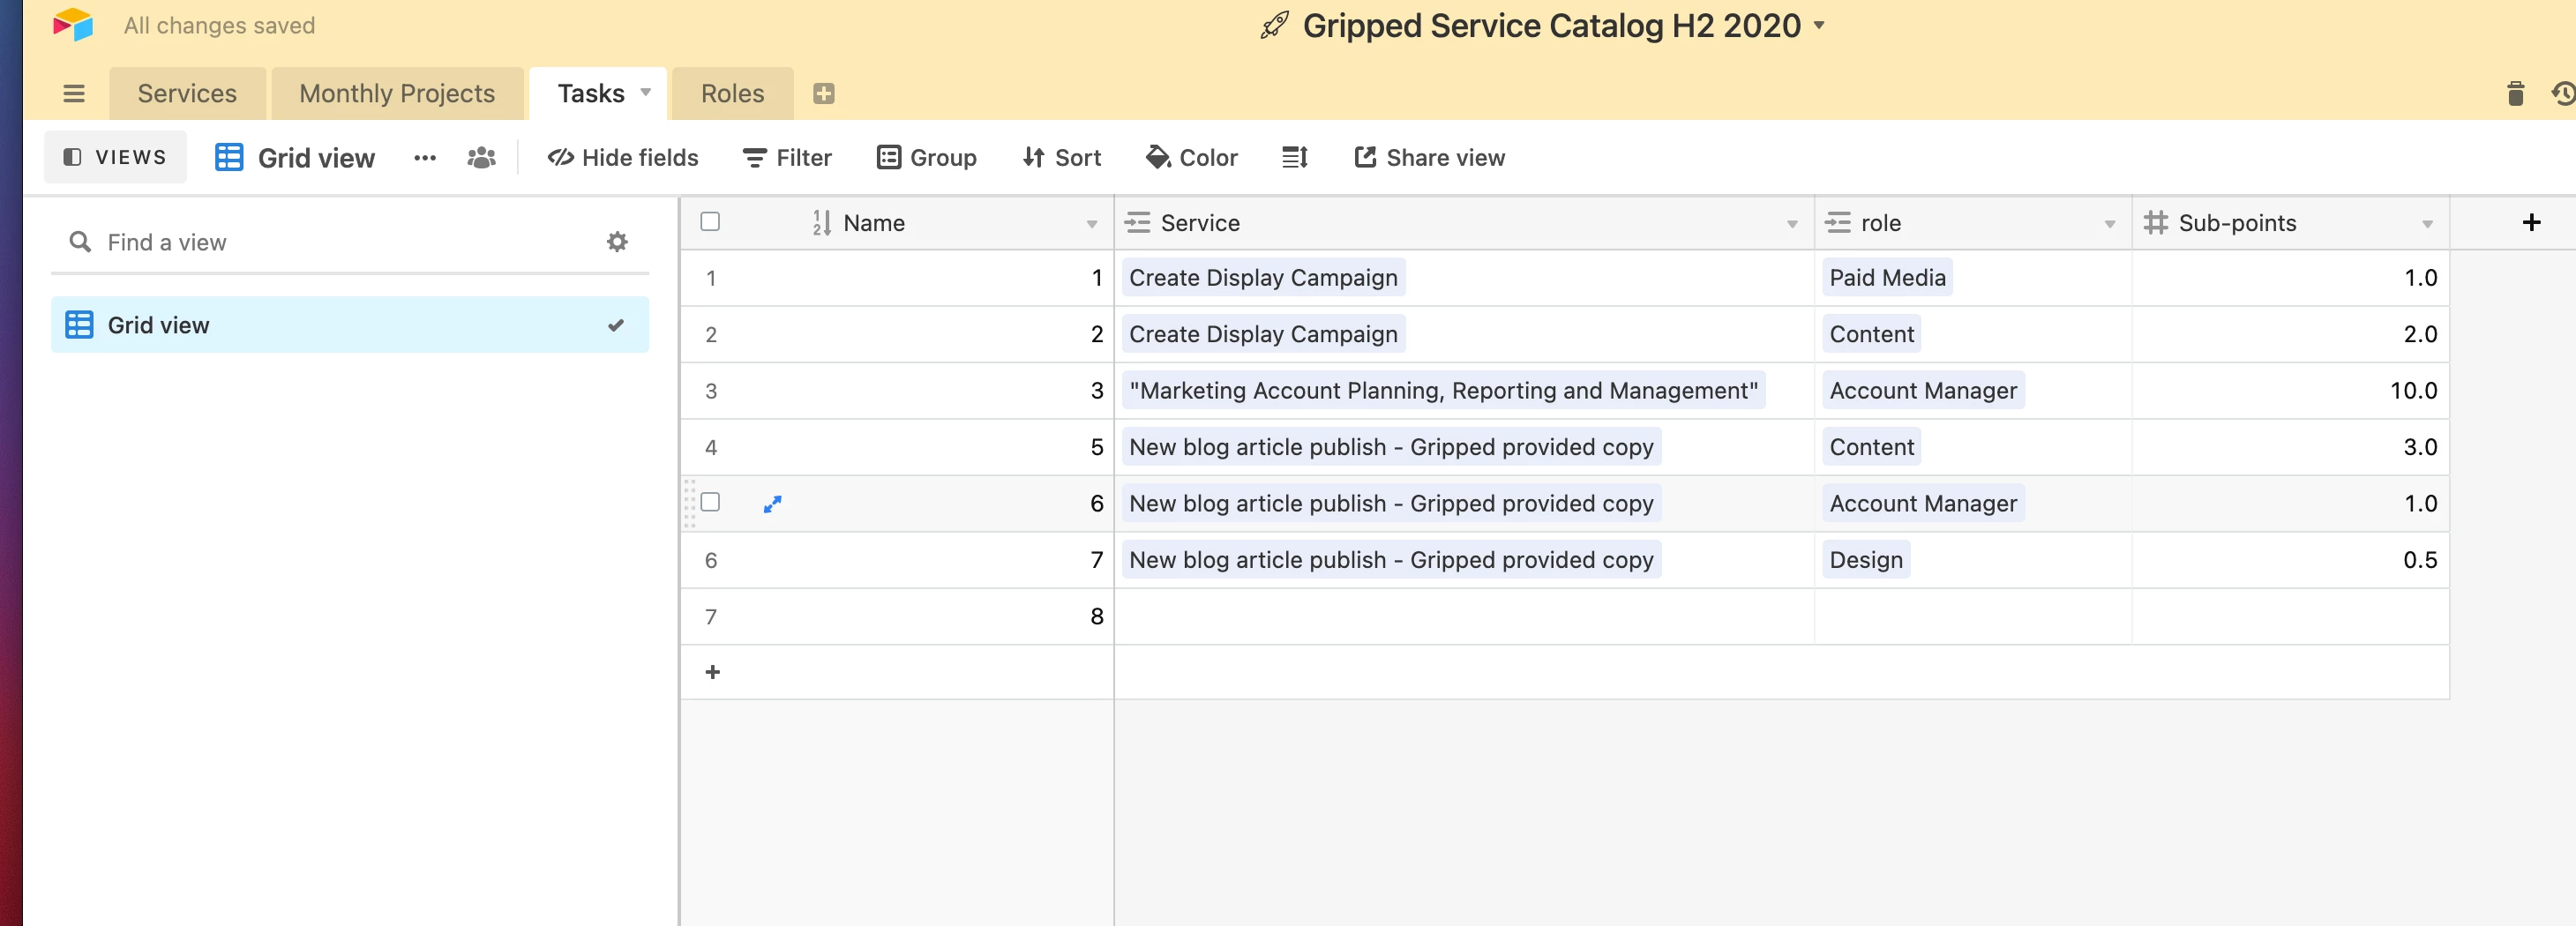
A lot of our services are further broken down in terms of the resource required to deliver them (i.e Account Managers, Content Team, Design Team, Development Team etc.) and the total points for each item may be broken down into a fixed number of points per team. For example, creating a blog article is 3.5 points in total but those points are broken down across various teams.

What I am trying to do is enter a list of the services for each customer, for each month, but then have it further breakdown to show me the actual resources required and the points for each resource so that I can see at a customer and also a global level the points needed for each team, each month.

In the example below I have the same ‘Blog article’ but now broken down by the effort required by each team to deliver the service. This is what I envisaged seeing that in Airtable once I had added the ‘services’ at high level. How the data is presented is less important to me, but I do need to be able to total the points per team required, per customer or company wide, each month.

Desired Points Forecast breakdown

Any help is much appreciated!

Ben
3 Replies 3

Hello @Ben_Crouch!

I could see this workflow in Airtable in a couple of different ways— so I’ve created the below short video to walkthrough two possible workflows I could see working for your scenario.

You can watch the video here!

Here is the formula I used in the video to have a dynamic team time via project type:

IF(
    FIND("Design Team", {Team Involved}),
    SWITCH({Project Type},
        "Blog Post",  3600,
        "Article", 2000
    )
)

Let me know if I can help provide any more information, and if this helped answer your question please mark it as the solution :white_check_mark: .

Ben_Crouch
6 - Interface Innovator

Hey Rose, first of all I really appreciate you jumping in and offering to help out. I kind of get where you’re going with the suggestion, but I’m not 100% my use case has been understood or that the solution is scalable.

If I were to use the terminology you suggested then I’ll point out where the crucial piece is missing:

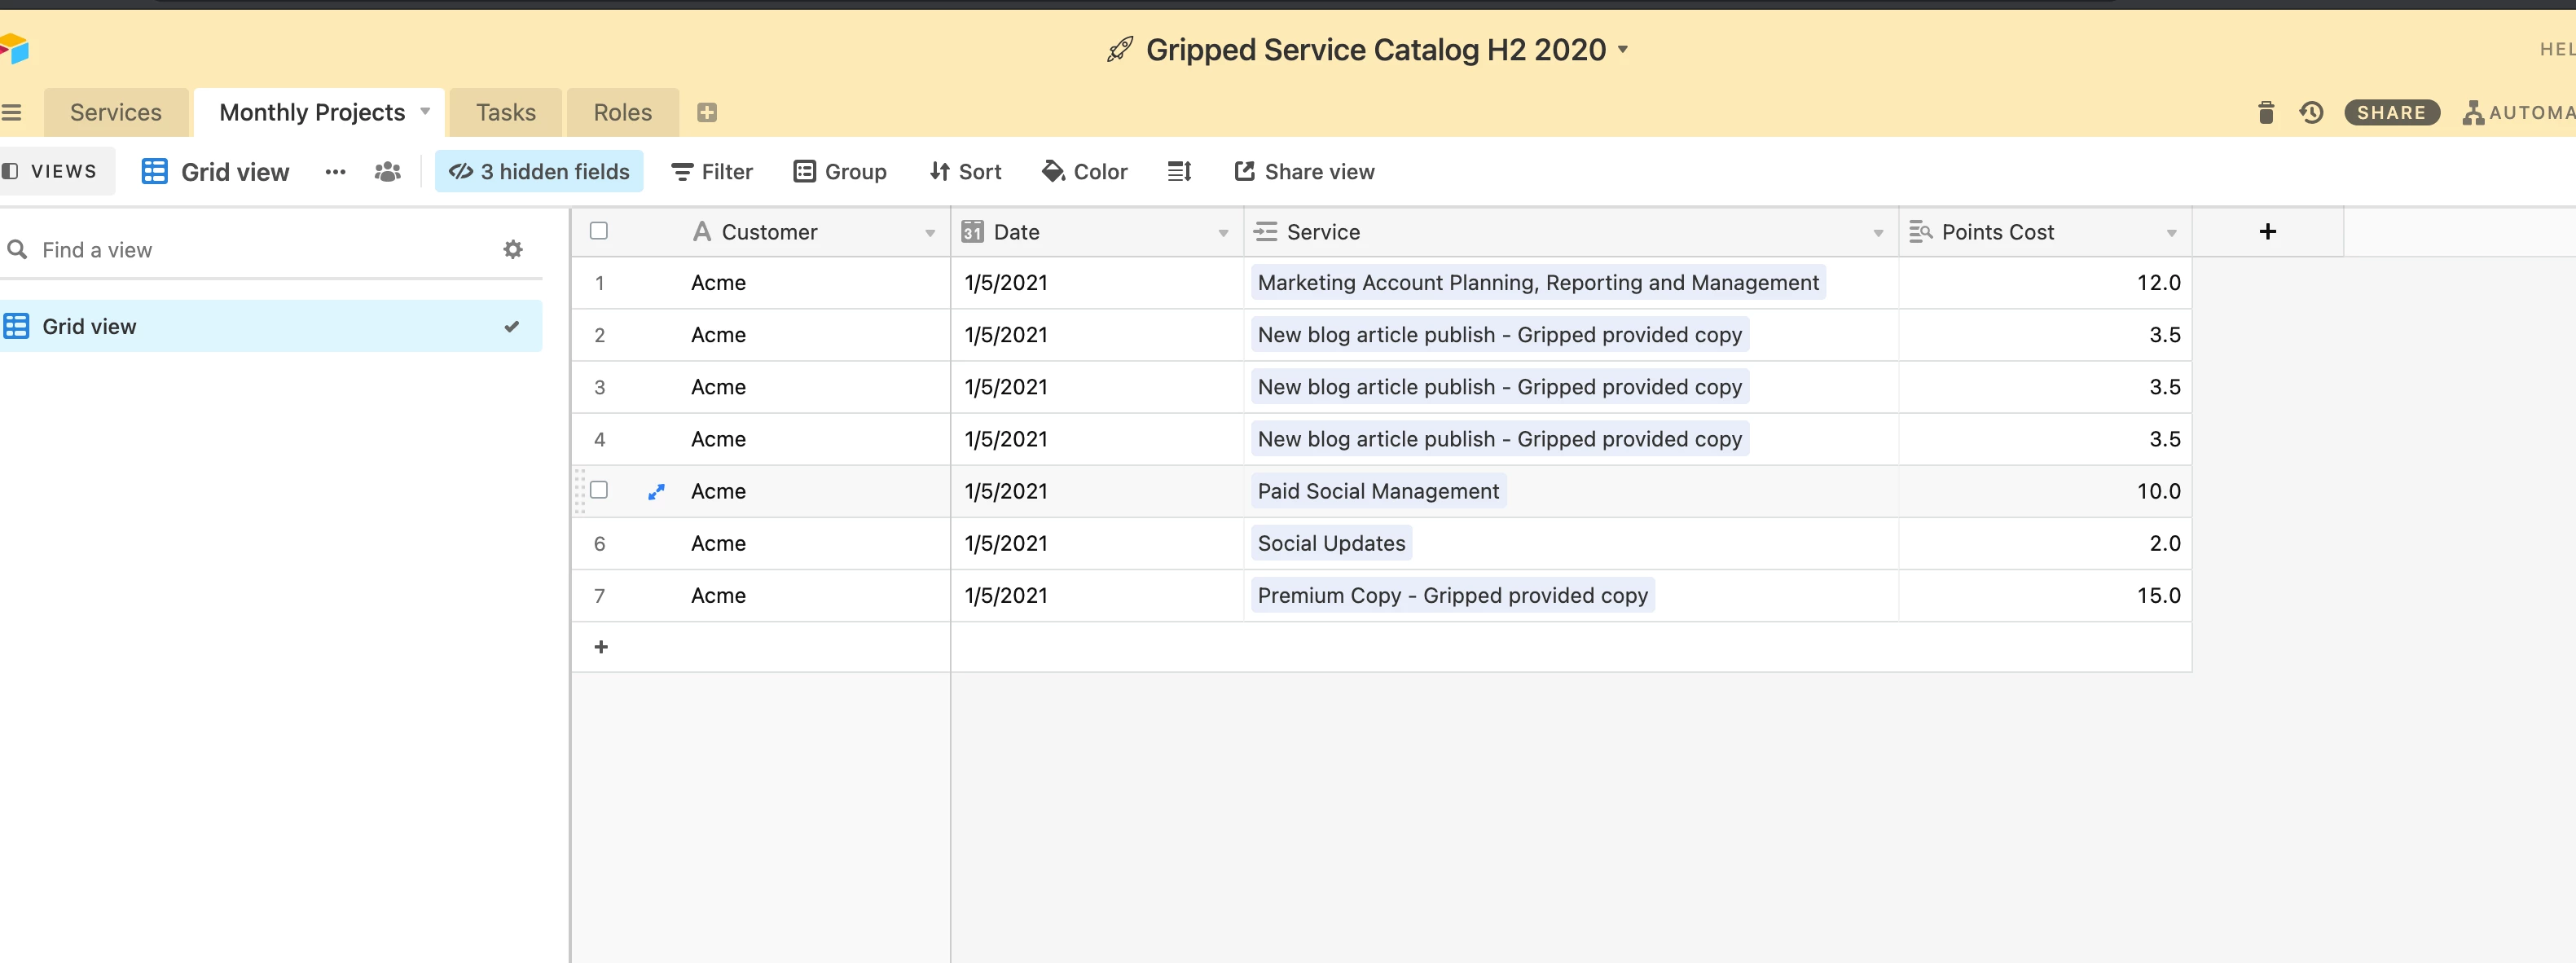
We have ‘projects’ - which are a series of ‘services’ delivered across a time frame. Each service has tasks which take up different time from different teams. I’ve created some of these tables in the way I think they need to be created but I could do with some help sanity checking if I have done them right and also how I then use them to breakdown the points for each tasks.

Snip20210507_29 Snip20210507_27 Snip20210507_26

Any feedback welcome!

Hey @Ben_Crouch!

To make sure I best understand what the crucial missing piece is here I think it’d be helpful for me to walkthrough your proposed workflow:

  1. Services- is a static table of services offered that doesn’t change (these will be linked to in other tables)
  2. Projects - this is a dynamic list representing the link between a customer(which I’d recommend creating another table for) and a service.
    • So I think that in your workflow this table should represent the relationship between a singular client linked to singular services? (i.e. so Acme should only have one “New blog article” record for each article they are requesting)
    • For the “Monthly” part of projects I’d recommend having a view that filters your records to the last month.
  • Here is also where you can see service tasks (the records tracking the work done by the design team in order to complete a service)
  1. (Service) Tasks -I’d recommend making this table a representation of the relationship between a team and a service, and the unit of work necessary to complete that service.
    • If a team’s points of effort is the same every time for each individual service (so if the design team always need 3 units of work for a design post, and they always need 2 units of work for a content campaign). I would recommend having this table represent the relationship between a team, and a service (like you have now).
      • This would mean removing the “points” field from the Monthly Projects table and creating a rollup field on the Services table to sum how many total points each service uses. (from the Service Tasks table)

Here is a video I created walking through what these tables would look like in real time:
See the video here!