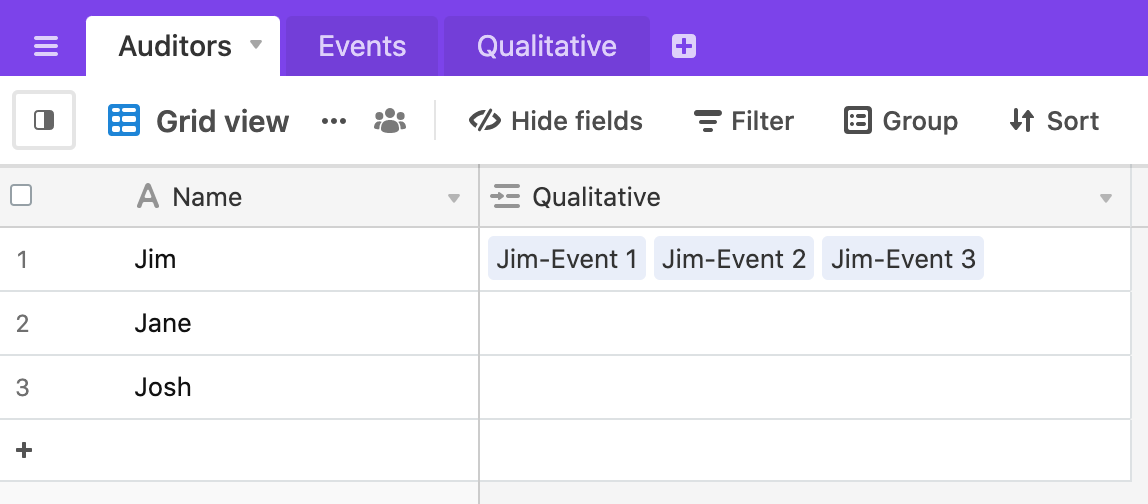
A group of us (“auditors”) are conducting an audit of the features of 100 virtual events. The responses were gathered in a spreadsheet and I’m moving to AT. I’ve created my main table. The anchor column lists the individual event names (domopoluzza, Zoomtopia, AWS, etc.). A series of columns of checkboxes and multi or single selects and others accounts for the various event attributes (date, free/paid pay model, live/recorded, networking, number of sessions, and other virtual event features).
Then, for each event, we also have 10 qualitative questions that require written answers. In the current spreadsheet, each event has a separate tab. Column A lists the auditor’s name. The columns are the 10 questions. Each auditor then adds their responses to each of the questions. This current spreadsheet has 101 tabs - the summary of data on tab 1 and each of the individual events/qualitative questions on the remaining 100.
Here’s my question - how do I handle the 100 qualitative tabs? The same way? Or in AT a second tab again listing the events so I can group by event the multiple inputs from multiple people, or something else?
Thanks for the community’s assistance!


