Help

Financial reporting & forecasting

2287 2
cancel
Showing results for 
Search instead for 
Did you mean: 
yvo
4 - Data Explorer
4 - Data Explorer

Hi all!

I'm new to Airtable hoping it can help me to design an Investment Tracker including forecast reporting and graphs for the next X years.  If I have an investment which is saved in a table with eg. 

Start date
End date
Amount
Interest (per month or year)
Exit fee at end of duration
Interest payment (month/qtr/yr/rollup)

I want to get rid of the 'Excel way of working' where I have to create a large spreadsheet with 12 months a year and many fields to fill. What would be the best way or workaround to have reporting values per month/qtr/yr? 

Reporting in terms of return per... / Cash Flow per... / etc.

Thanks!

2 Replies 2
Lom_Labs
7 - App Architect
7 - App Architect

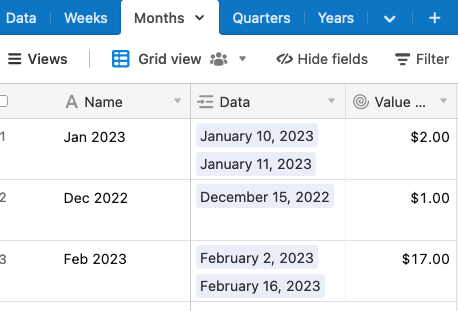
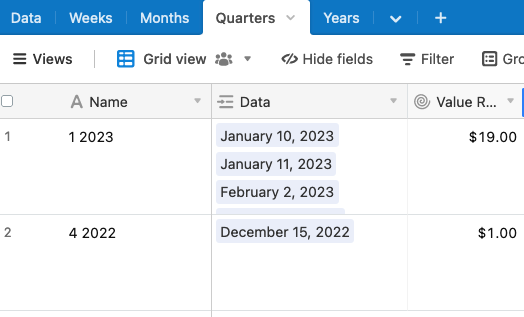
Hi Yvo, you can do this with an automation.  Use a formula field to display the month, quarter or year value of that record, and use the automation to copy that value into a linked field to the appropriate table.

Here is a template that you can use

Screenshot 2023-02-10 at 1.26.56 PM.png

Screenshot 2023-02-10 at 1.27.01 PM.png

 Screenshot 2023-02-10 at 1.27.30 PM.png 

yvo
4 - Data Explorer
4 - Data Explorer

Thx! That's a nice example. But I still have to enter every row in the Data View. How to get all those values inbetween the periode when entering only a starting date (01/01/23) and end date (31/12/26) ? For example when you enter 'monthly interest' as additional value, it should be possible to make a report or graph with alle monthly calculated fields over those 3 yrs (instead of filling out 36 rows like in Excel).