I am designing a base for tracking participation in a weekly Food Box.
I am trying to organize the data in such a way that I can track the number of people who've selected a certain type of produce for any given Food Box Day. Ultimately, I'd like to be able to create a pivot table in my dashboard interface along the following lines:
| Produce | 5/1/24 | 5/10/24 |
| Basil | 2 | 0 |
| Cilantro | 1 | 1 |
| Cucumbers | 1 | 1 |
| Celery | 0 | 1 |
I have a table for Food Box Days which includes a record for each date. Separately, I have a Food Box Participation table, which includes a record for each person signed up for each day.
In the Food Box Participation table, I am using a multi-select to record each person's produce preferences for each Food Box Day. The table looks like this:
| ID | Person Name | Food Box Day (linked) | Produce Preferences (Multiselect) |
| 1 | Bob | 5/1/24 | Basil; Cilantro; Cucumbers |
| 2 | Judy | 5/1/24 | Basil |
| 3 | Jane | 5/10/24 | Cilantro; Cucumbers |
| 4 | David | 5/10/24 | Celery |
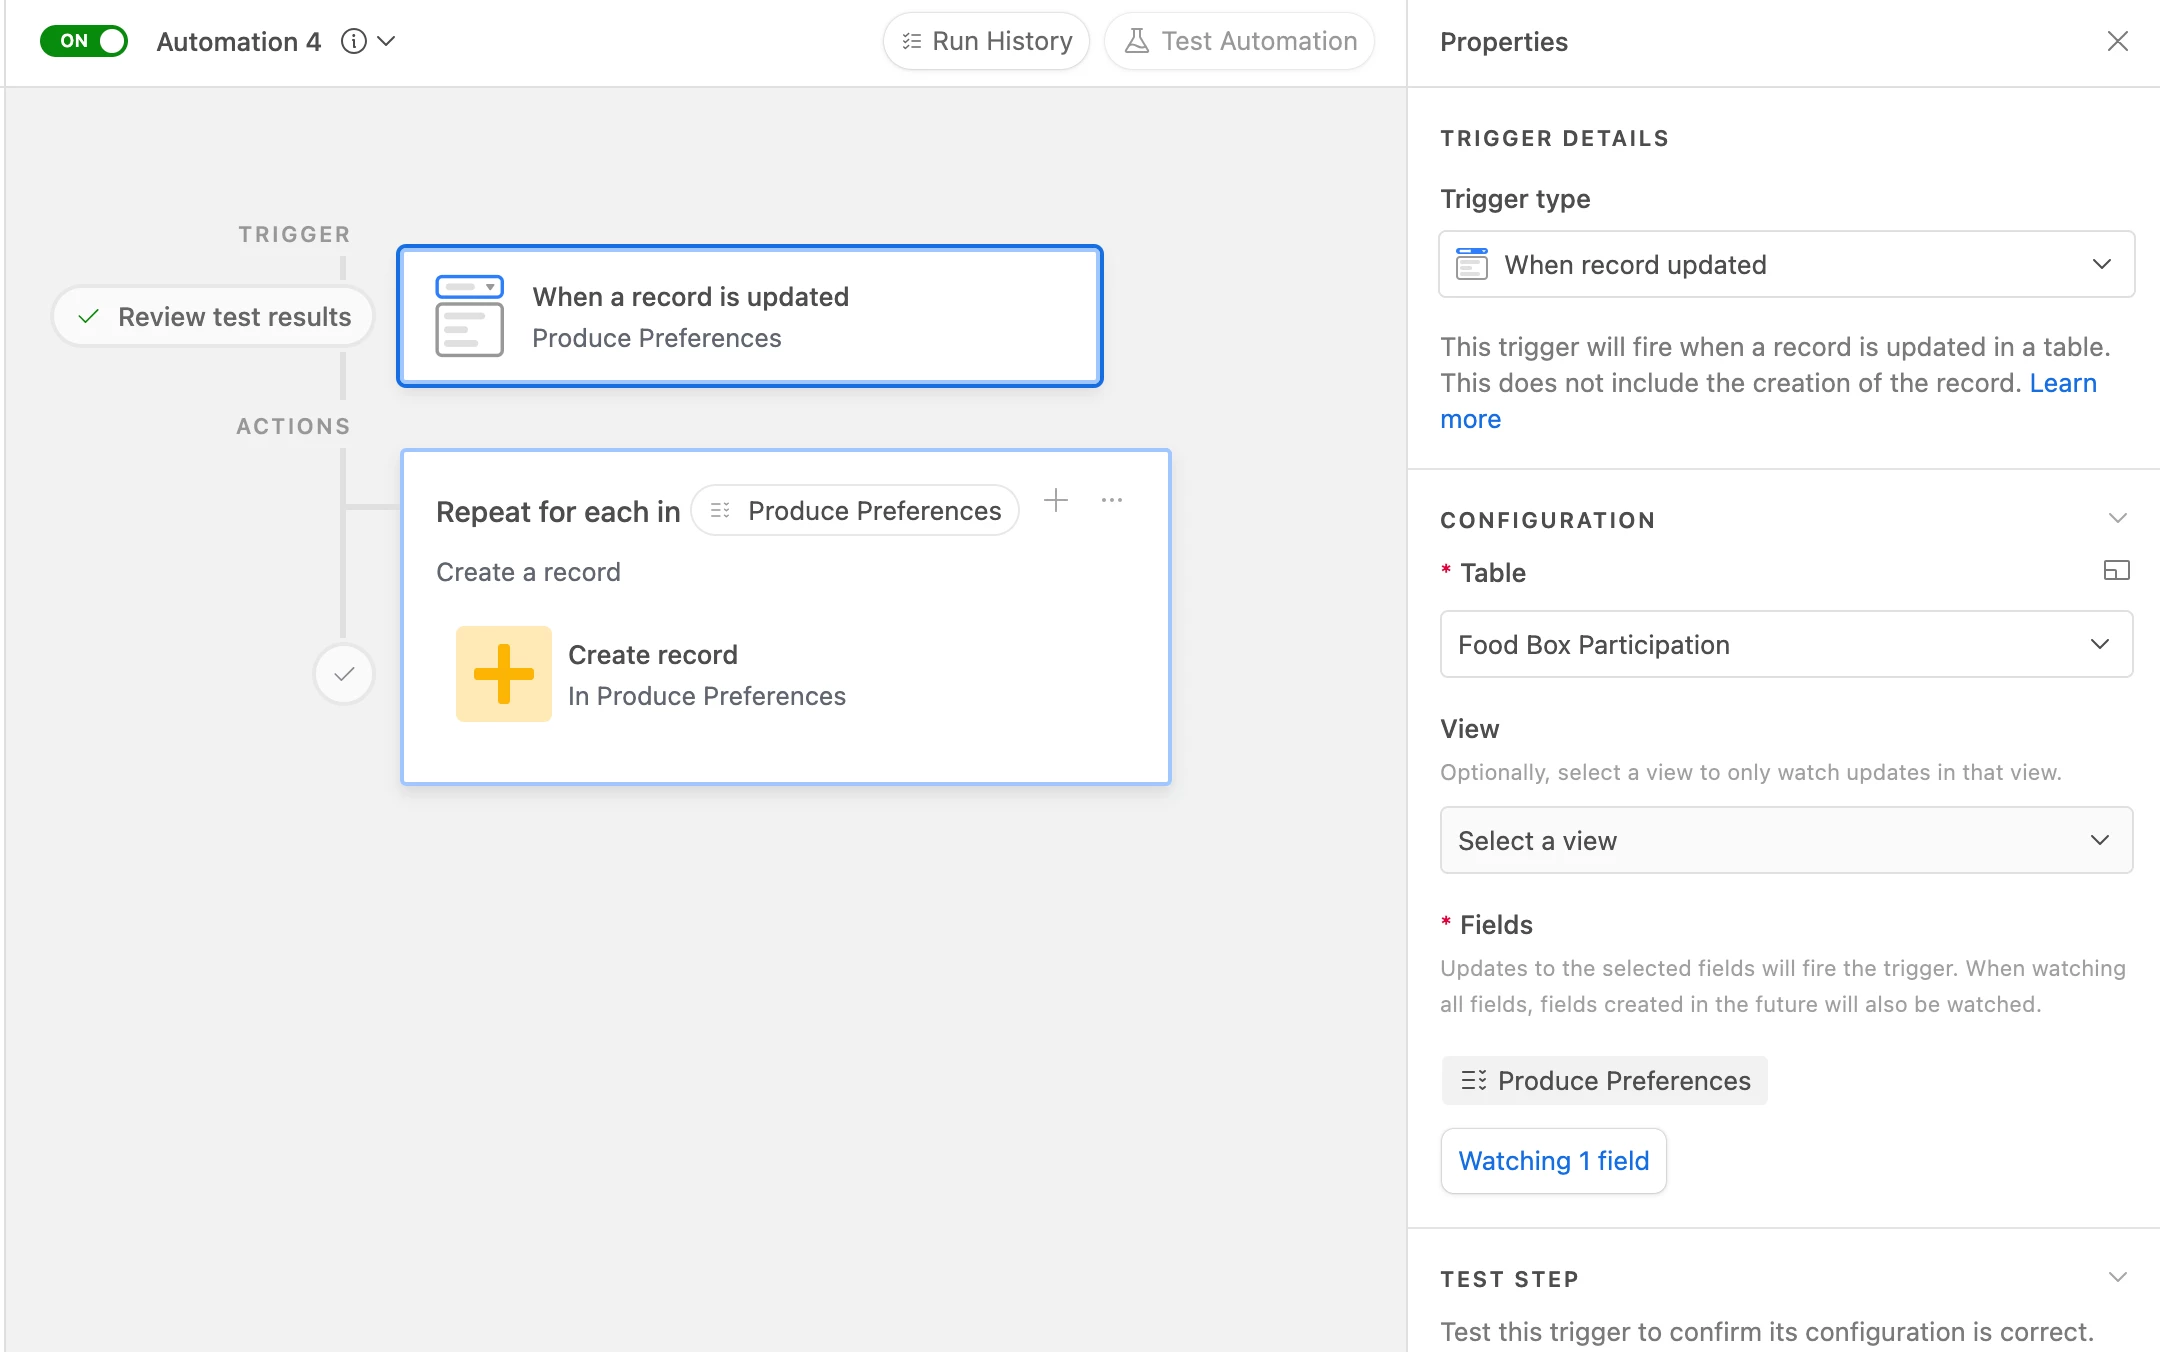
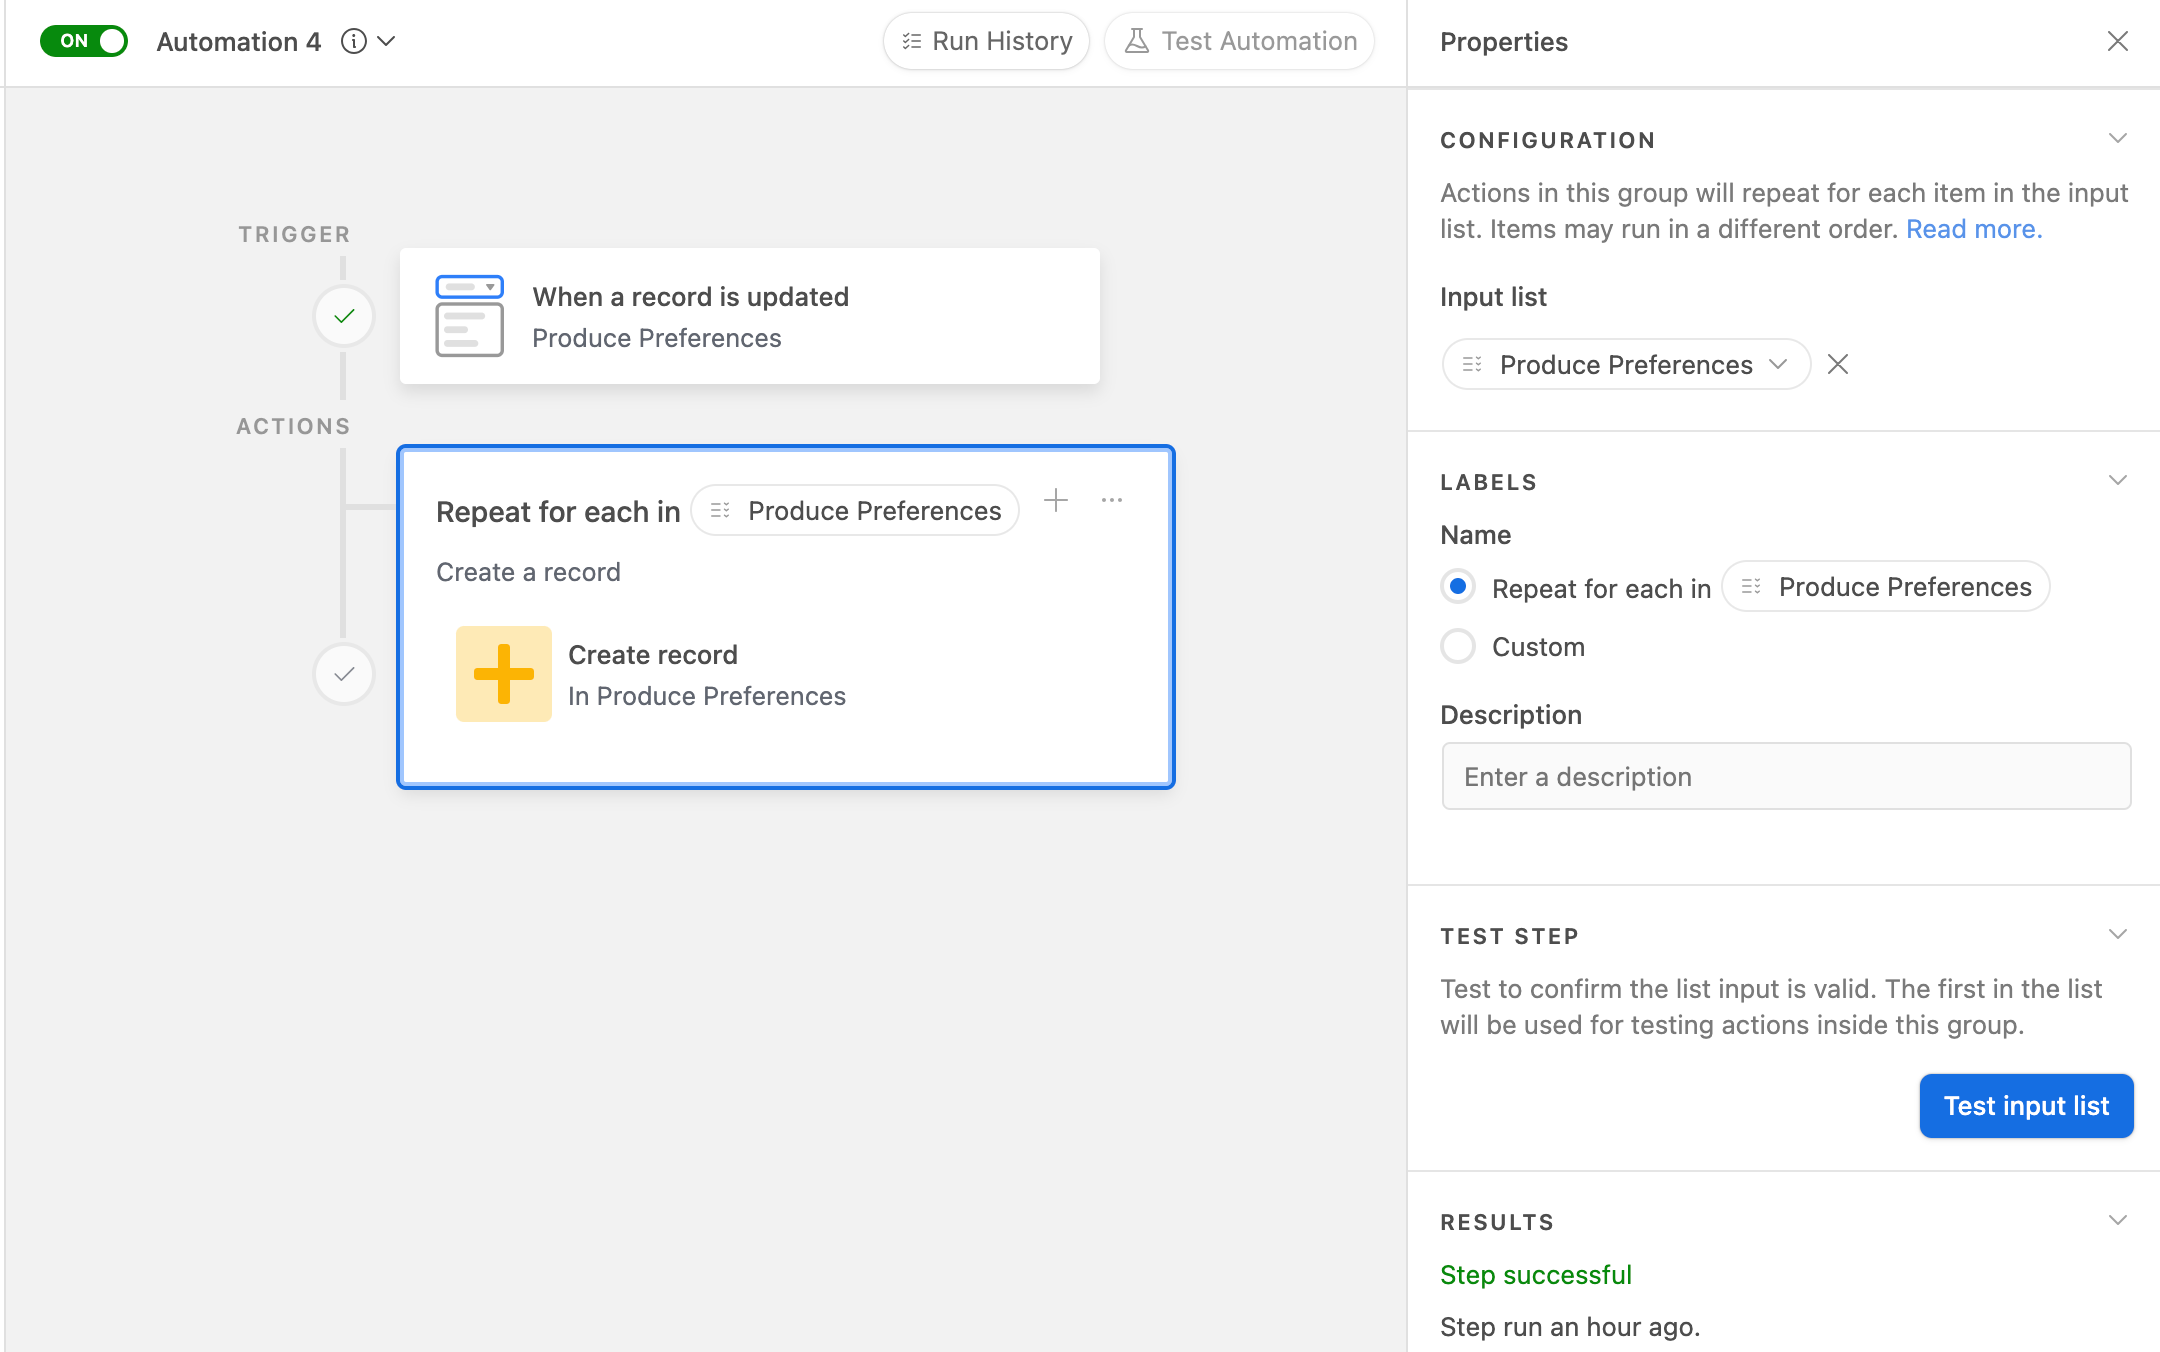
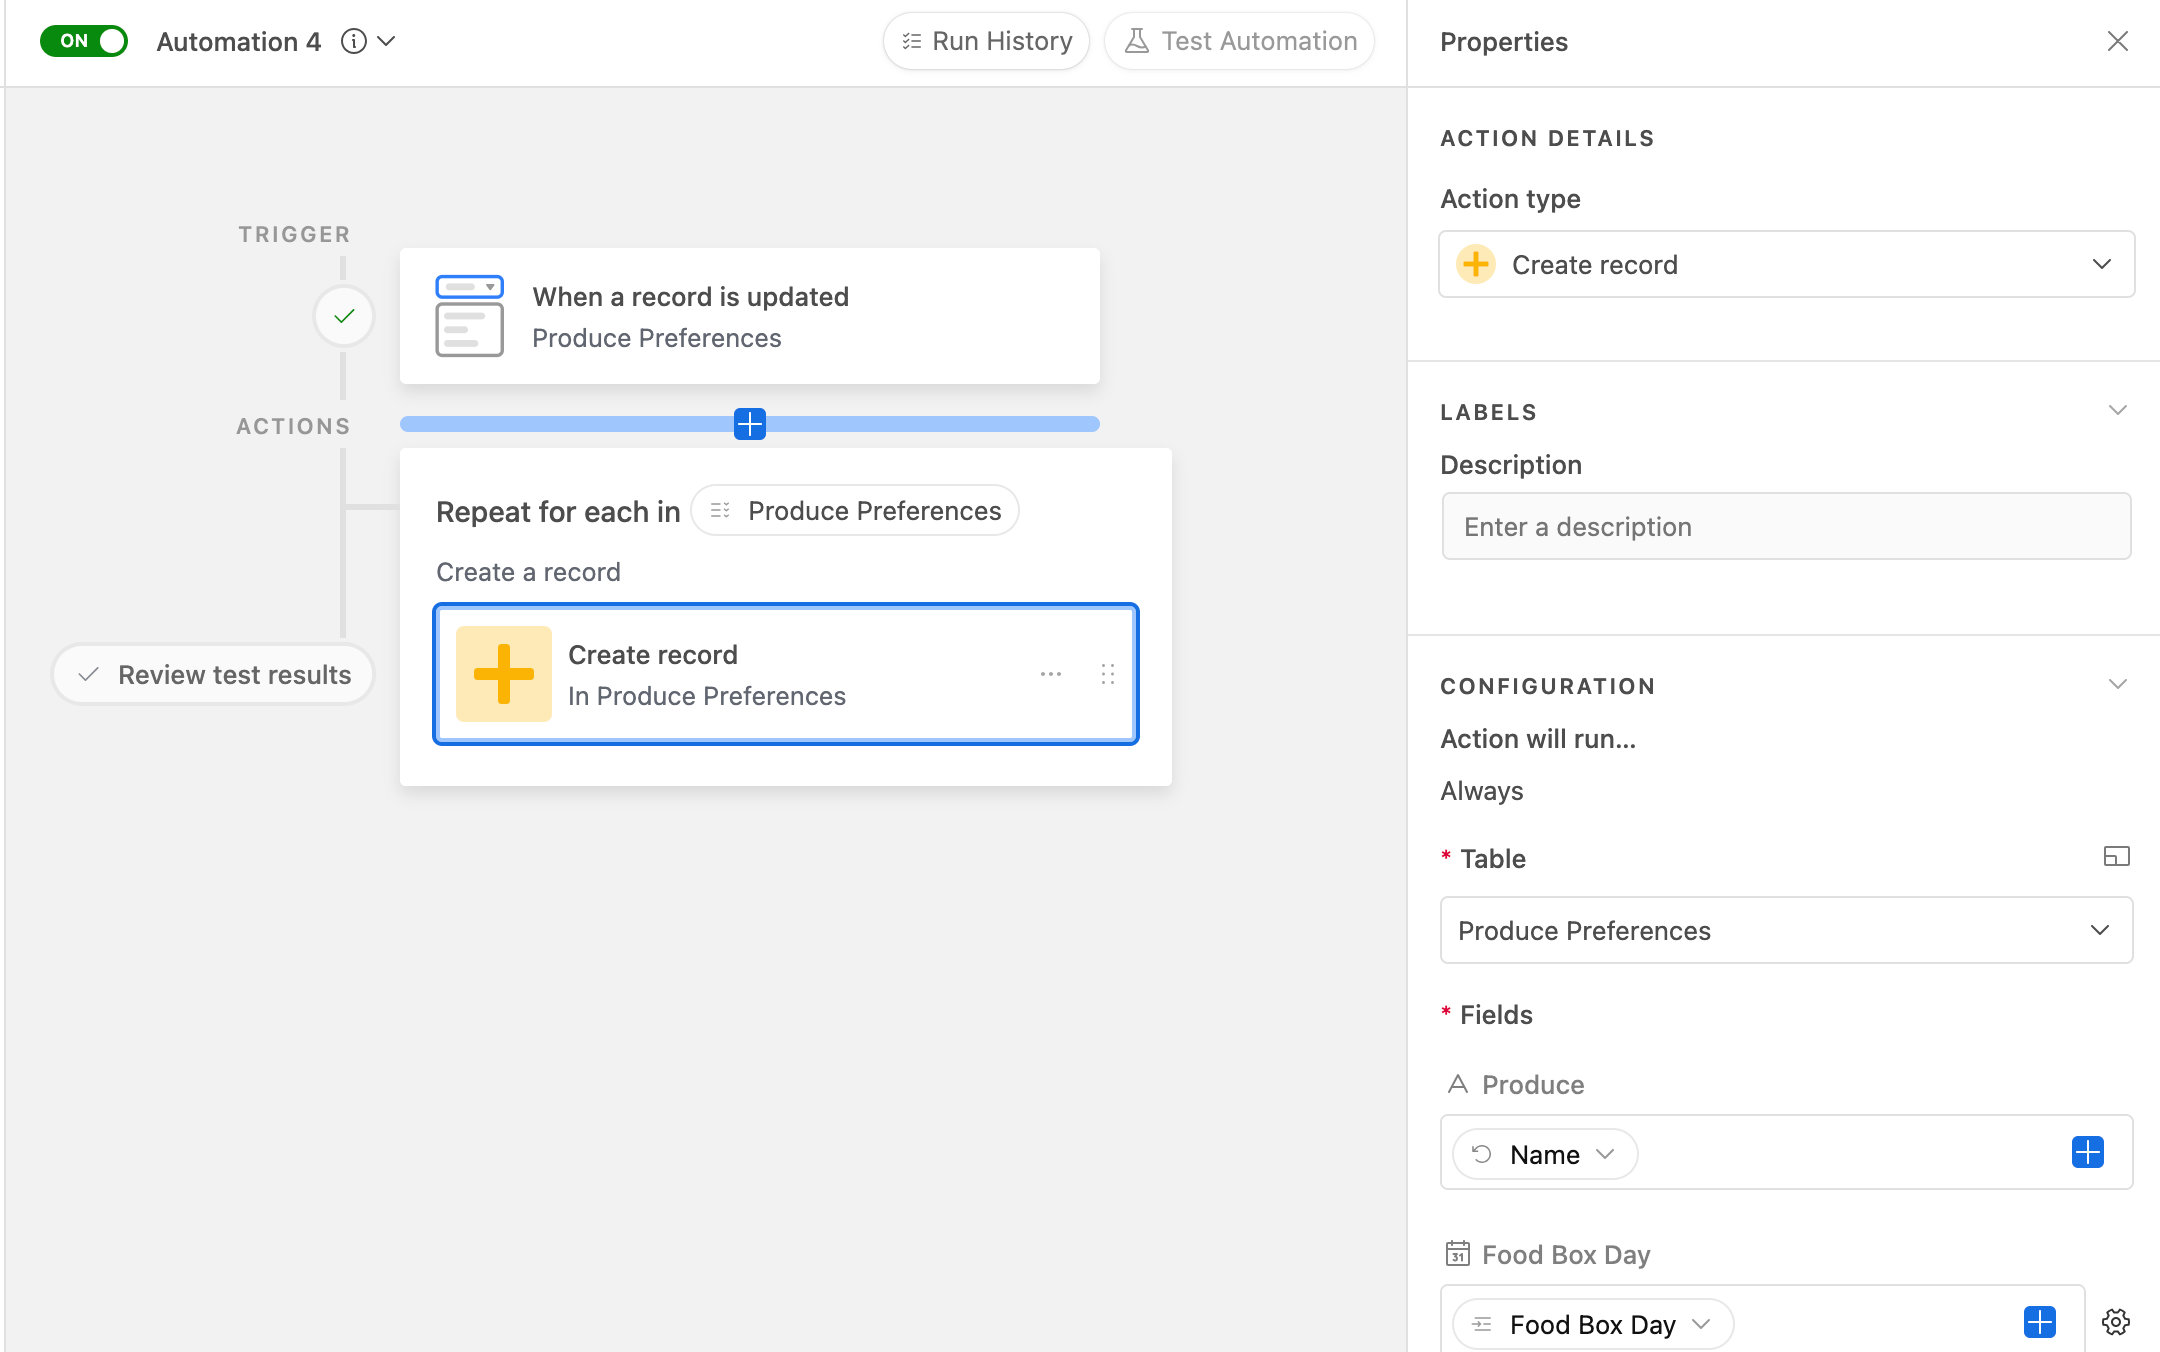
I've tried creating an intermediary Produce Preferences Table, which has a link to the Food Box Participation table and looks like this:
| Produce Item | Food Box Participation (linked) | Food Box Day (Lookup from Food Box Participation) |
| Basil | 1; 2 | 5/1/24 |
| Cilantro | 1; 3 | 5/1/24; 5/10/24 |
| Cucumbers | 1; 3 | 5/1/24; 5/10/24 |
| Celery | 4 | 5/10/24 |
But the pivot table ends up looking like this:
| Produce | 5/1/24 | 5/1/24; 5/10/24 | 5/10/24 |
| Basil | 2 | 0 | 0 |
| Cilantro | 0 | 1 | 0 |
| Cucumbers | 0 | 1 | 0 |
| Celery | 0 | 0 | 1 |
Any thoughts on how I should proceed?