Help

Re: Summarize Data From Different Tables

1691 0
cancel
Showing results for 
Search instead for 
Did you mean: 
ryanmelendez93
4 - Data Explorer
4 - Data Explorer

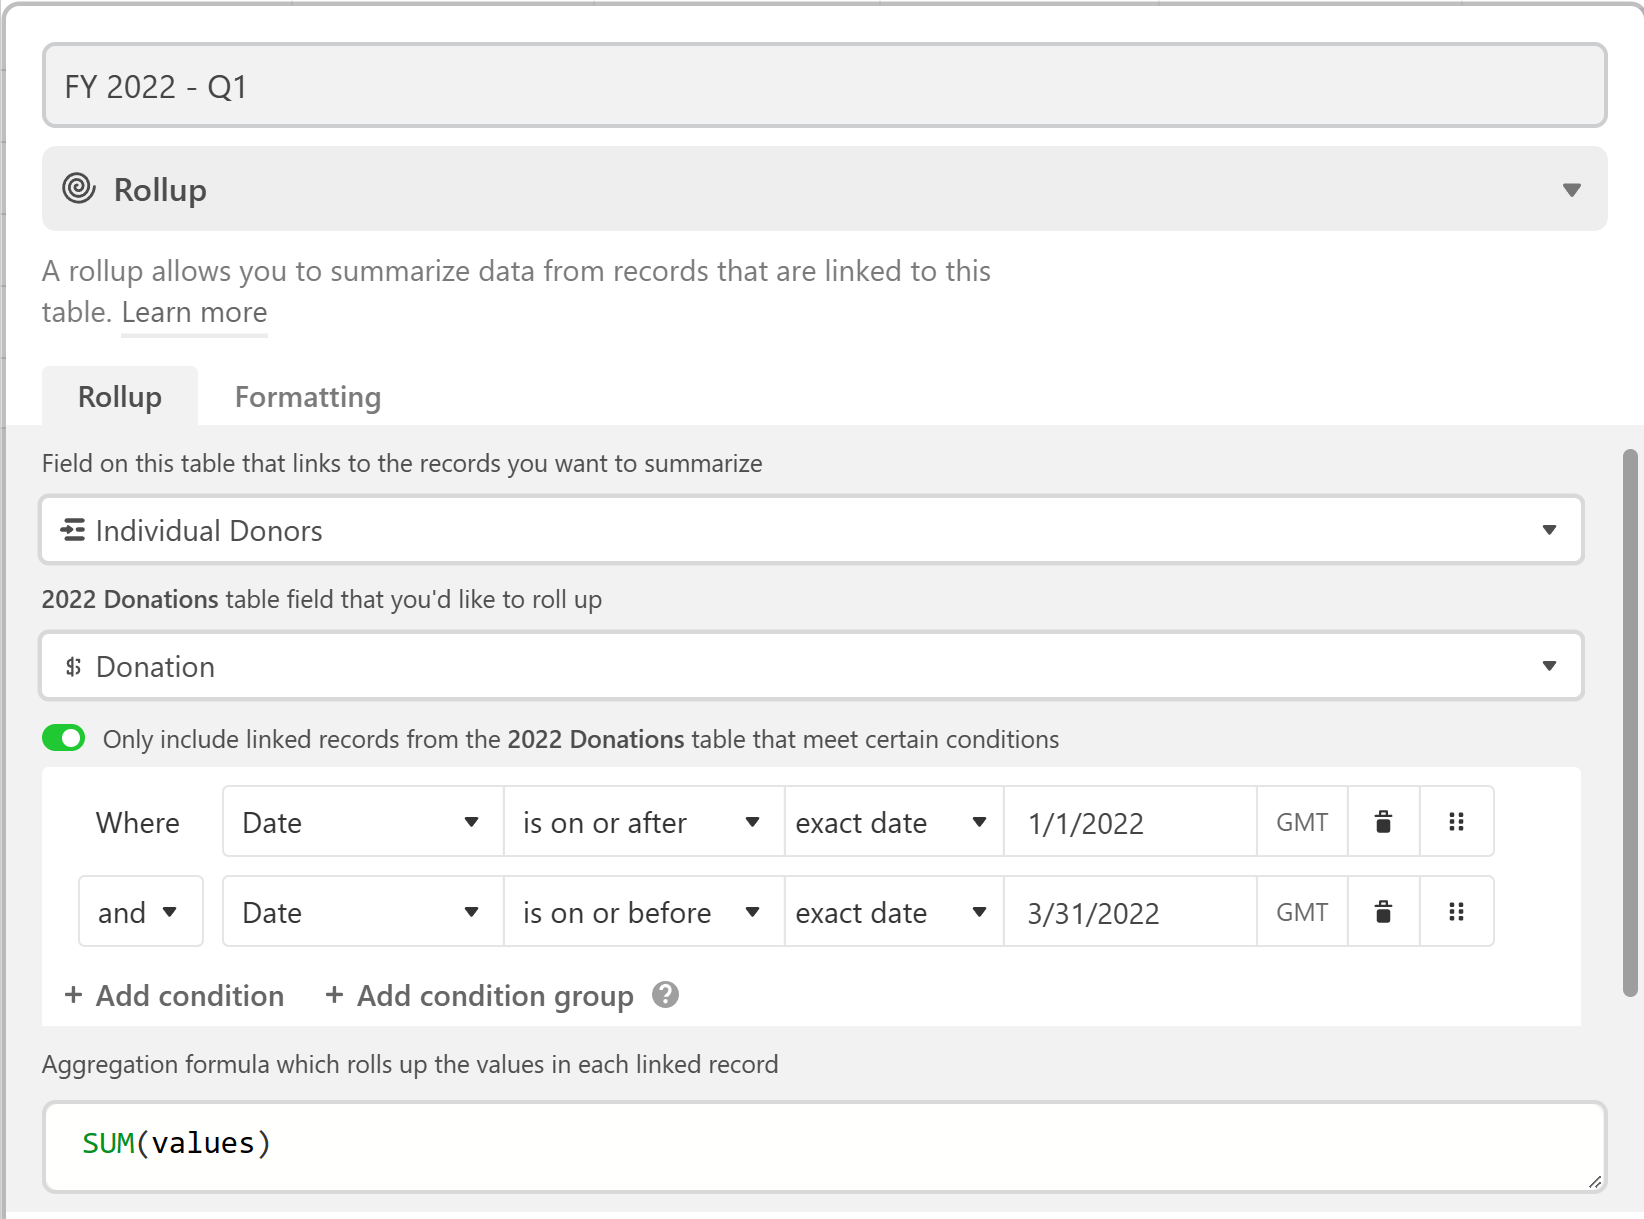
I made a base to better track and manage nonprofit donations. I have 2 tables set up: 2022 and 2023, with a third table I want to use as a summary table. Each table has a donor name, gift date, and gift amount, among other irrelevant information, as well as views broken down by quarter.

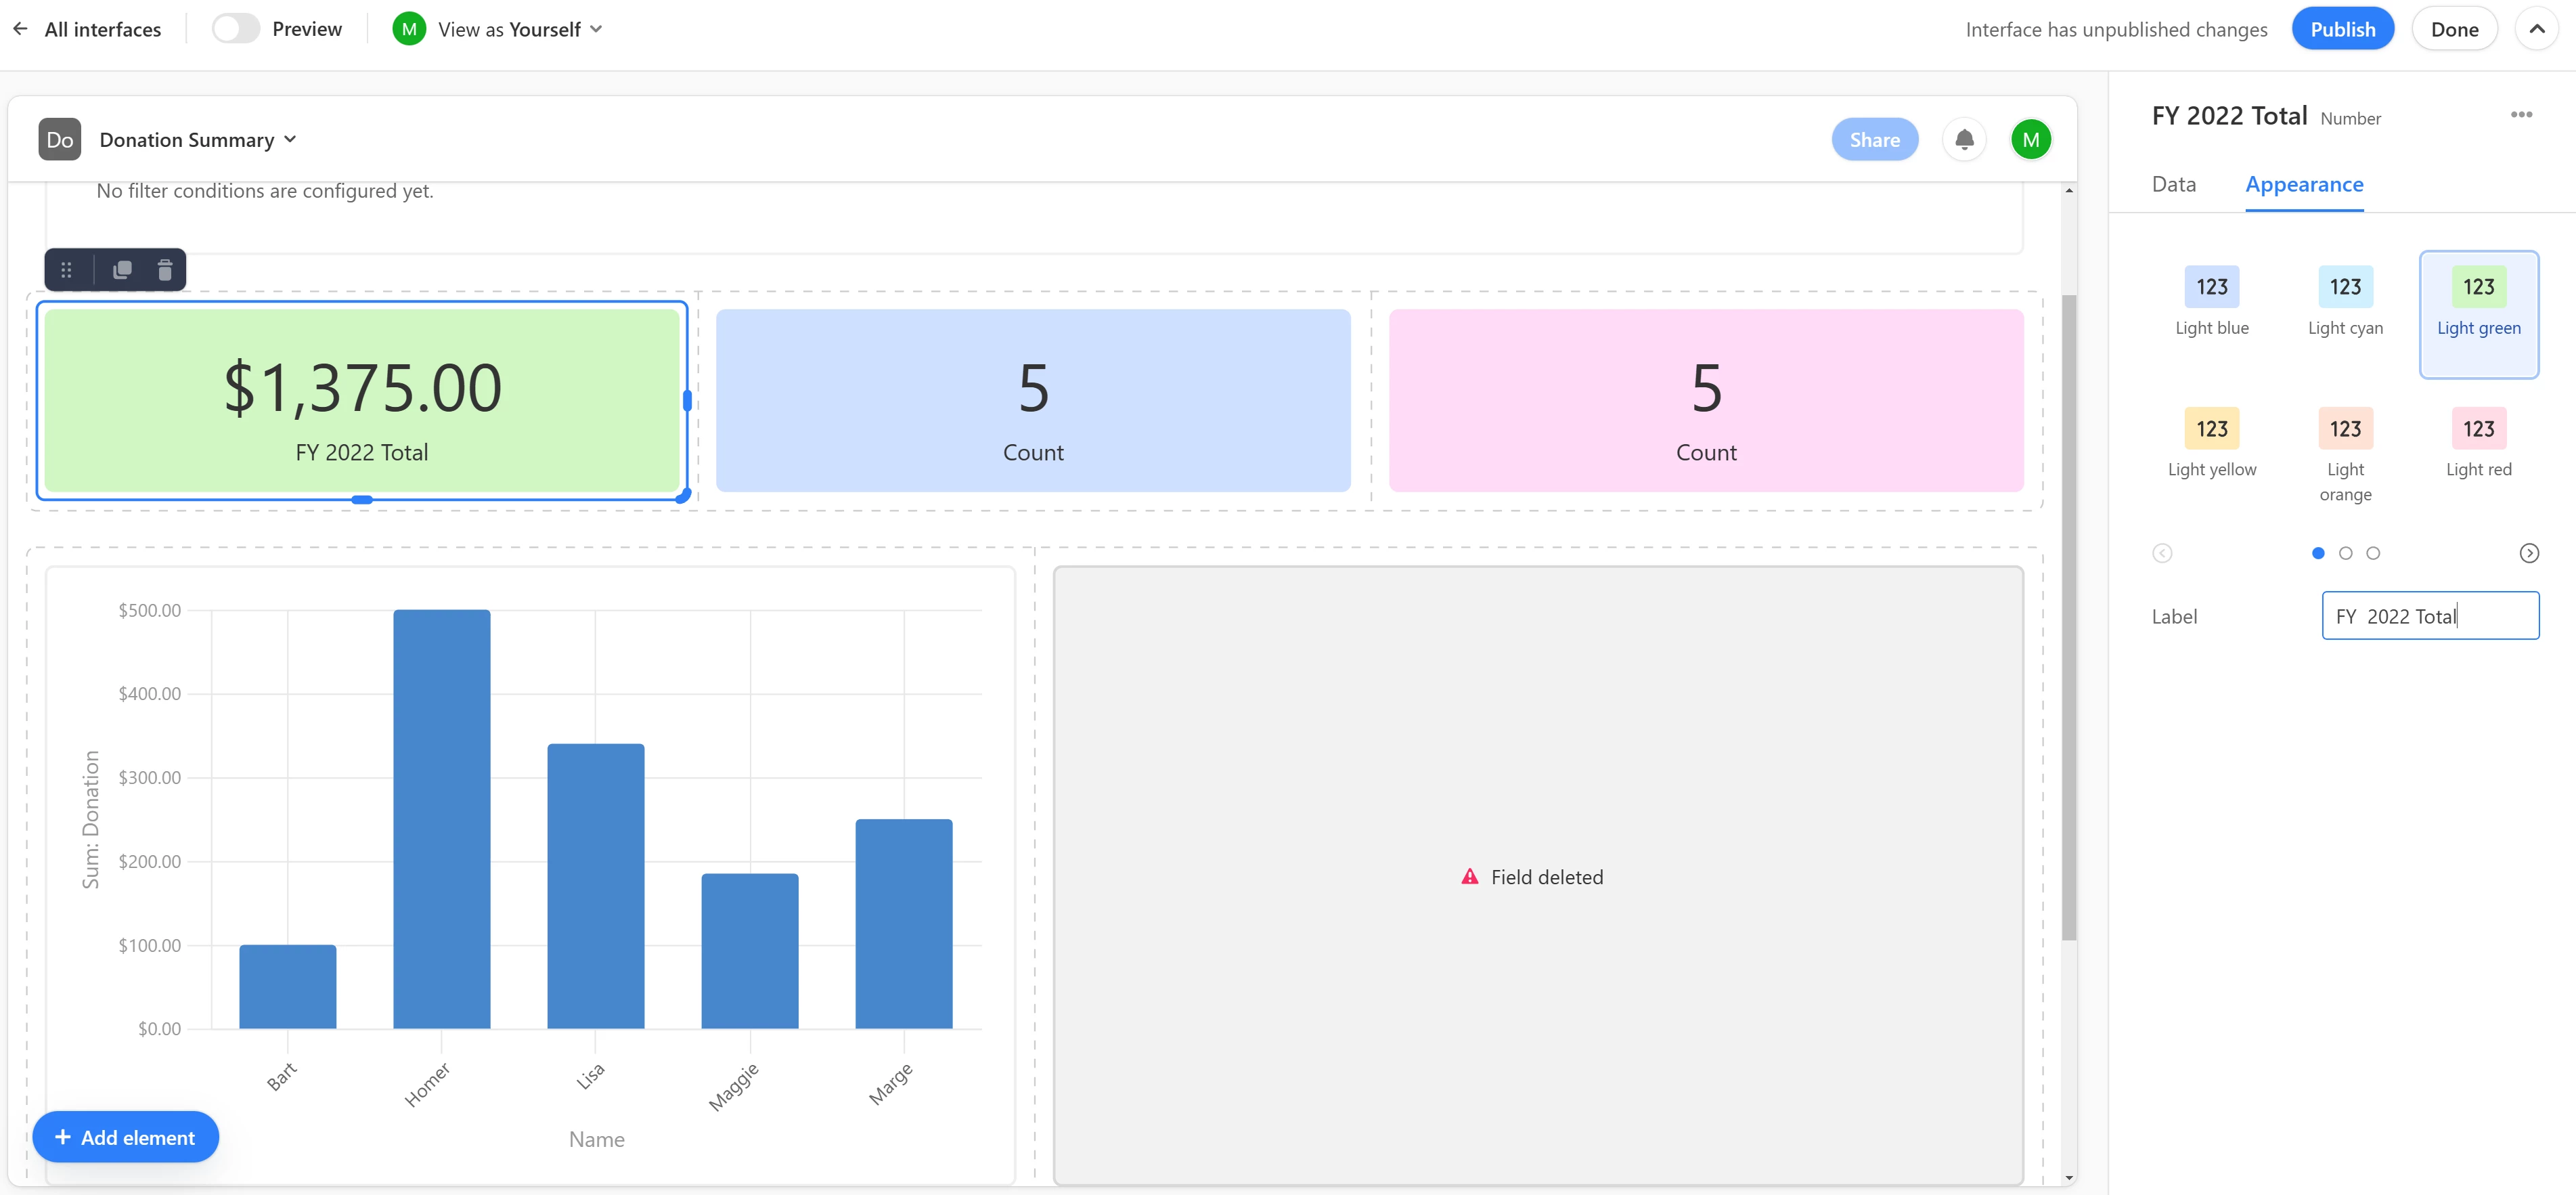
What I am looking to do, is have that third table list the total gift amounts and the total by quarter as I have it in my views. I've been trying to look up formulas but nothing seems to work.

I tried linking but all that does is create 2,000 new rows in my summary table, which I don't want. I just want to take the total it presents me, and plug it in here so I can summarize the data, and compare to last year's data. 

If there isn't a way to do this in AirTable, is there something I can do to push that data automatically to a google sheet where it can calculate and update as new information is added? 

2 Replies 2
AirBenderMarcus
7 - App Architect
7 - App Architect

You will want to use a rollup field that can perform calculations on linked records.


What is the reason you separated out the tables by year? Combining the tables into one will make the rollup a bit easier to manage but that depends on what you need, of course.

It sounds like all you'd need in your Summary table is a single record that links to ALL the donation records which can then roll up the data how you want. Here's how I think that can look.

AirBenderMarcus_0-1673479421987.png


Below is a screenshot of how I set up the Rollup field for the quarter breakouts. It's easy to set up manually and won't take long since there are only 4 a year, but there are ways to automate this if you want as well.

AirBenderMarcus_1-1673479467761.png

If all you truly want is a high-level summary, maybe you can even create a dashboard using an Interface. You'll be able to add a filter that lets you tweak the results live based on criteria making it a much more dynamic experience. But again, that's all personal preference.

Airtable has Interface templates. This is how far I got after just a minute or so of modifying the Interface template.

AirBenderMarcus_2-1673479728773.png


Is any of this helpful?

I separated by year because I didn't want to have a long list of views I'd have to scroll to get to info I need. I wanted things separate. The part that trips me up about the rollups is, when I try the linked fields, all it does it make 2,000 new rows in my "Year over year" table, and doesn't list all the donors in a single cell like you have it.

I have tried some interface stuff but it still seems limited as the two tables can't be linked there. I can have displays of fields from only one source, which is really counterintuitive.