Help

Weekly Business Health Check - Form, Data, Dashboard - How to do it?

323 3
cancel
Showing results for 
Search instead for 
Did you mean: 
TonyD
4 - Data Explorer
4 - Data Explorer

Hi,  I'd like to create a "Business Health Check" Dashboard, and I'm thinking Airtable might be a good way to do it,  but as a new user I'm not sure how to start. 

Basics:

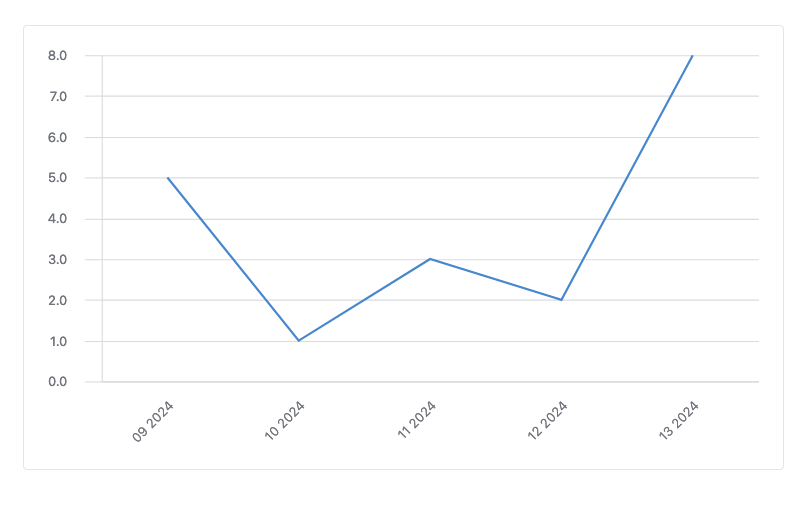
1. Dashboard view:   Show changes to each category over the past few months (line charts most likely)
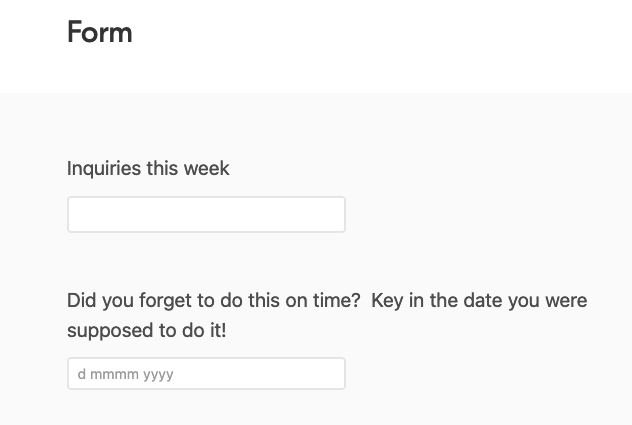
2. Form:
    Owner would fill this out weekly with data for that week

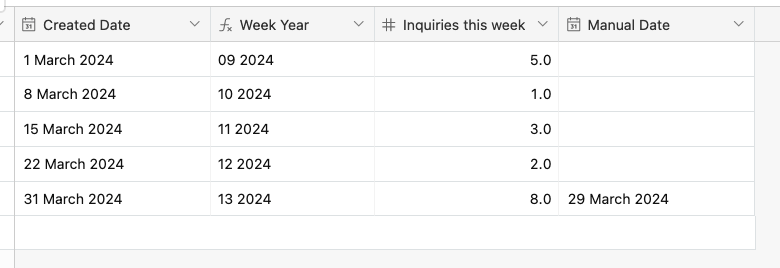
3. Data/Questions (this is where I'm not sure how to lay the data out for the questions, or to record it in a way that the charts could use it).  Question examples
    - Time Period (Date 1 to Date 7 - usually a week - ie Mon-Sun)
    - Booked for how many days out (likely do this as a number field:  1,2,3,4 ..... 
    - How many new inquiries did you get from x source this week?  Number field
    - How do you feel about business this week?  - Drop down selector - Not Good, Good, Indifferent
      
Doing the form so it captures the time period is probably my first stumbling block.

Any tips or tutorials you can suggest would be appreciated.    

Thank you. 

3 Replies 3

Hmm, instead of using a time period, perhaps you could just use the submission time of the form and use a formula field with DATETIME_FORMAT to format that date into a [WEEK] - [YEAR], e.g. 23 2024?  You mentioned the owner would fill out the form weekly so this should work most of the time, and on the weeks where he forgets to do it you could have a Date field set up so that you could set the date manually instead.  You could then have that chart set up to display the weeks on the X axis so you can see the changes

What you've got in mind is pretty straightforward and I think you won't hit any problems setting this up yourself I think

Lemme know if you could use an example and I'll throw something together!

Thanks for the reply!   I had thought of the week number idea, but most people don't think that way normally, so I think it might be a bit of a learning curve, and I would likely need to convert that to show some sort of date period at some point.   But from the chart perspective it would help with displaying the data.  

If you have an example to share of how you would set the fields/form inputs that would be helpful yes! 

Thank you again.


Sure, here!

So you've got your table set up like this:
Screenshot 2024-03-15 at 7.07.28 PM.png

The "Week Year" field is set up like this:

DATETIME_FORMAT(
  IF(
    {Manual Date},
    {Manual Date},
    {Created Date}
  ),
  "ww YYYY"
)

And so if there's a manual date set, it'll use the manual date.  If not, it'll use the Created Date.  (For this example I used a Date type field for the Created Date field so that you can see how it would work.  In production you'd just use the formula CREATED_TIME() instead)

And your form would be like below.  I'm assuming the workflow is probably something like they have to key in this week's metrics every Friday afternoon.  Lemme know if the workflow is different so we can figure stuff out
Screenshot 2024-03-15 at 7.07.39 PM.png


And your chart would look like this:

Screenshot 2024-03-15 at 7.07.31 PM.png