- Mark as New
- Bookmark
- Subscribe
- Subscribe to RSS Feed
- Permalink
- Report Inappropriate Content
Feb 13, 2024 10:20 AM
Hello.
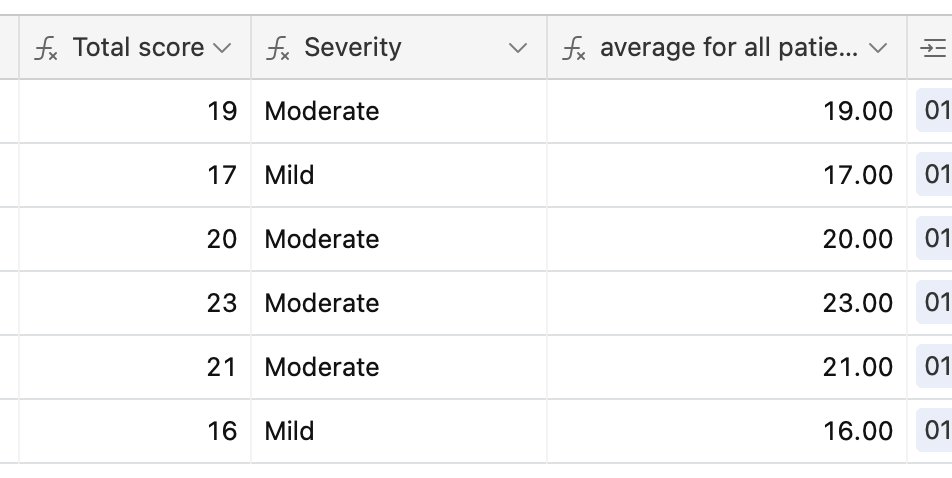
I need to calculate the average of the entire column (called total score) but using the average formula I am getting the average of each cell. Is there any solution please?
Thanks
Solved! Go to Solution.
Accepted Solutions
- Mark as New
- Bookmark
- Subscribe
- Subscribe to RSS Feed
- Permalink
- Report Inappropriate Content
Feb 14, 2024 07:58 AM
Hmm, do you know how your Thunkable app parses the data from Airtable? The way we need to deal with this is going to be heavily influenced by how your app expects the data to be formatted.
Given that you want to have a graph across time, and assuming you only want to create a graph for the 'Bladder' table, you could try:
1. Creating a new table called 'Days' or some such and link it to 'Bladder'
2. Creating a formula field with DATETIME_FORMAT that'll convert your `Created` field value into a string
3. Copying the text from step 2 into the linked field to the 'Days' table
- This should automatically create one record per unique day
4. In 'Days', create a rollup field to output the data you want. You mentioned you wanted the average, so just select the field you want the average of, then use the formula `AVERAGE(values)` and you should be good to go
This'll give you a table where each record is a single day, with the average of the field you picked from the 'Bladder' table, which allows you to create a graph across time on the X axis and the average on the Y
- Mark as New
- Bookmark
- Subscribe
- Subscribe to RSS Feed
- Permalink
- Report Inappropriate Content
Feb 13, 2024 12:00 PM
A database generally doesn't behave that way, but if you collect the records you need in a view and scroll to the bottom airtable does show a summary, generally the sum, but you can change the column you need to other options, including average.

- Mark as New
- Bookmark
- Subscribe
- Subscribe to RSS Feed
- Permalink
- Report Inappropriate Content
Feb 13, 2024 12:04 PM
Yes, I did that already, but I really need to have that value showing on a column because I need it for a graph.
- Mark as New
- Bookmark
- Subscribe
- Subscribe to RSS Feed
- Permalink
- Report Inappropriate Content
Feb 13, 2024 12:26 PM
Best I can think of is to create a new table with row (maybe just one) that links to the records in this table. You can then use a rollup field to do the calculation on the linked records. There are some highly talented contributors on this forum who have covered rollups far better than I can, but in a simple enough case I know it can be done.

- Mark as New
- Bookmark
- Subscribe
- Subscribe to RSS Feed
- Permalink
- Report Inappropriate Content
Feb 13, 2024 06:26 PM
Yes, what @BillH said is the only way to do that in Airtable. It's very similar — but not entirely similar — to the global field trick that I demonstrate in this Airtable podcast episode. Note that I don't cover rollup fields in this video, but I talk about creating an extra table that links to all the records in another table. You would just add the rollup field to that extra table.
- Mark as New
- Bookmark
- Subscribe
- Subscribe to RSS Feed
- Permalink
- Report Inappropriate Content
Feb 13, 2024 07:50 PM
Adding on to what Bill mentioned, I usually end up creating an automation that'll automatically link all the relevant records to that one row in the new table so that the rollup's always up to date
- Mark as New
- Bookmark
- Subscribe
- Subscribe to RSS Feed
- Permalink
- Report Inappropriate Content
Feb 13, 2024 07:57 PM - edited Feb 13, 2024 08:53 PM
Yes… this is demonstrated in my video.
- Mark as New
- Bookmark
- Subscribe
- Subscribe to RSS Feed
- Permalink
- Report Inappropriate Content
Feb 14, 2024 05:15 AM
Thank you for sharing the video.
But still, as it is my first time using Airtable, I am struggling to do what I need.
Let me provide you more information on what I have and on what I need.
So, I have this Airtable that is connected to Thunkable. Here I have a rating (used to report symptoms), and the total score (sum of each individual symptom reported). In the end, I need to create a graph to display on Thunkable, and on that graph, I want to have the average of all patients and the specific patient total score across time (I have patient name and patient ID to identify the patient).
Can you please help me with this? Because for the rollup I need to link records, but I am not sure of which records need to be linked in this case.
Thanks in advance to all that are trying to help me.
- Mark as New
- Bookmark
- Subscribe
- Subscribe to RSS Feed
- Permalink
- Report Inappropriate Content
Feb 14, 2024 05:43 AM
Thanks, @ScottWorld and @TheTimeSavingCo .
- Mark as New
- Bookmark
- Subscribe
- Subscribe to RSS Feed
- Permalink
- Report Inappropriate Content
Feb 14, 2024 07:58 AM
Hmm, do you know how your Thunkable app parses the data from Airtable? The way we need to deal with this is going to be heavily influenced by how your app expects the data to be formatted.
Given that you want to have a graph across time, and assuming you only want to create a graph for the 'Bladder' table, you could try:
1. Creating a new table called 'Days' or some such and link it to 'Bladder'
2. Creating a formula field with DATETIME_FORMAT that'll convert your `Created` field value into a string
3. Copying the text from step 2 into the linked field to the 'Days' table
- This should automatically create one record per unique day
4. In 'Days', create a rollup field to output the data you want. You mentioned you wanted the average, so just select the field you want the average of, then use the formula `AVERAGE(values)` and you should be good to go
This'll give you a table where each record is a single day, with the average of the field you picked from the 'Bladder' table, which allows you to create a graph across time on the X axis and the average on the Y
