Help

Create Bar Chart from Date Fields

Topic Labels: Interface Designer
Solved
Jump to Solution
183 4
cancel
Showing results for 
Search instead for 
Did you mean: 
emsone
5 - Automation Enthusiast

Dear AT Community!

I'm collecting arrival and departure dates for an event setup period from workers. They can register through a form. In my base now I have two date fields with an arrival and a departure date for each worker. The setup period spans from 5th May to 16th May.

The question is: How many workers are on site each day?

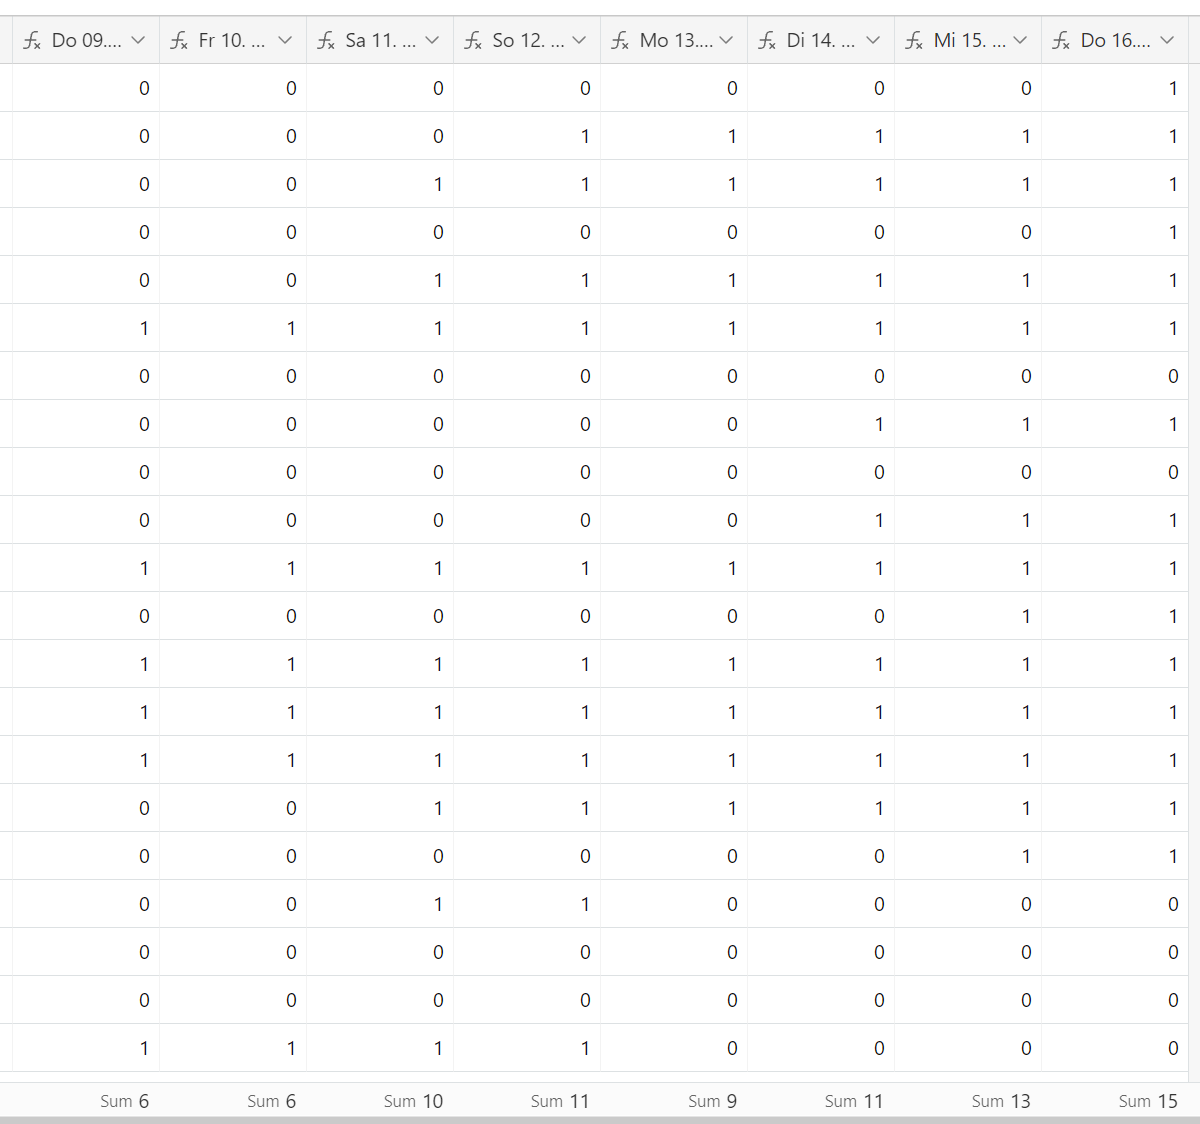
In order to answer that question I created 8 formula fields and wrote a simple formula to extract the needed information from the date fields. The output looks like this:

emsone_1-1713266619719.png

Now in the bottom row the sums are given which equal the number of workers on site each day.

I tried to create a bar chart in an interface showing the days on the vertical axis and the number of workers on the horizontal axis. To no avail. Any ideas on how to approach this would be appreciated. I'm kinda stuck.

Best regards
Henry

1 Solution

Accepted Solutions
Alexey_Gusev
12 - Earth
12 - Earth

Hi,
Your approach is not good, because you need to create extra field for every next day.
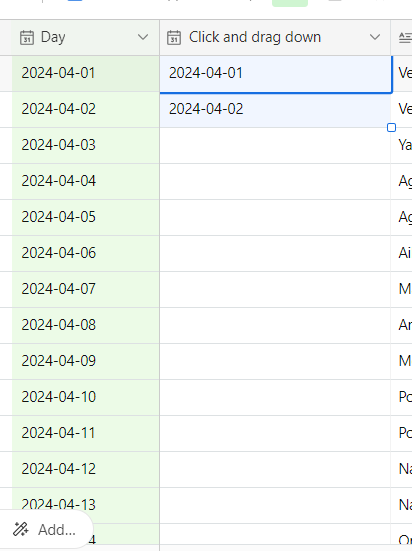
Better solution is to create the table of days. You can put first date in the primary field of the first record, then put next day in the second record,
then select these two cells,
then click on little square at right-down of the cell and drag it down to the number of days you need
Alexey_Gusev_0-1713321841218.png

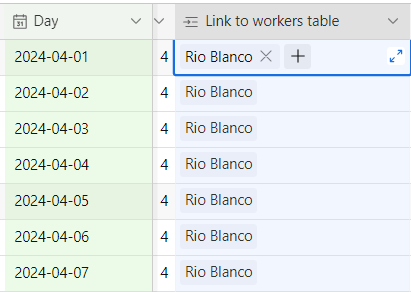
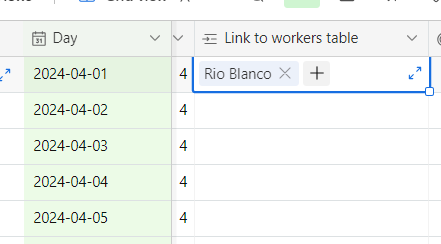
Link this table to a table of workers. Create link field, then add first worker, then copy the cell and paste it to whole field. (I just took random table of values and 30 days of this month, to act as test data) 
Ctrl+C
Alexey_Gusev_1-1713322087450.png

CTRL+V

Alexey_Gusev_2-1713322128650.png

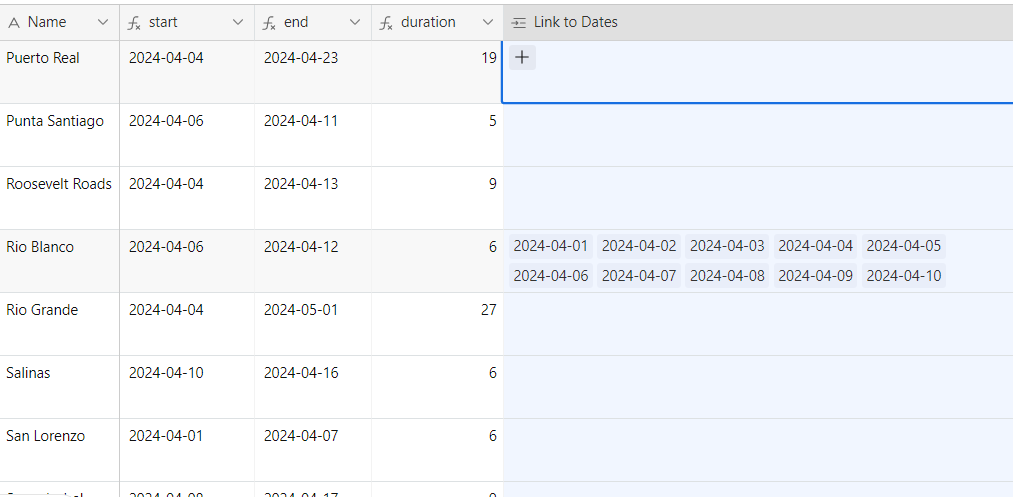
And now switch to workers table and do the same:
Alexey_Gusev_3-1713322244336.png

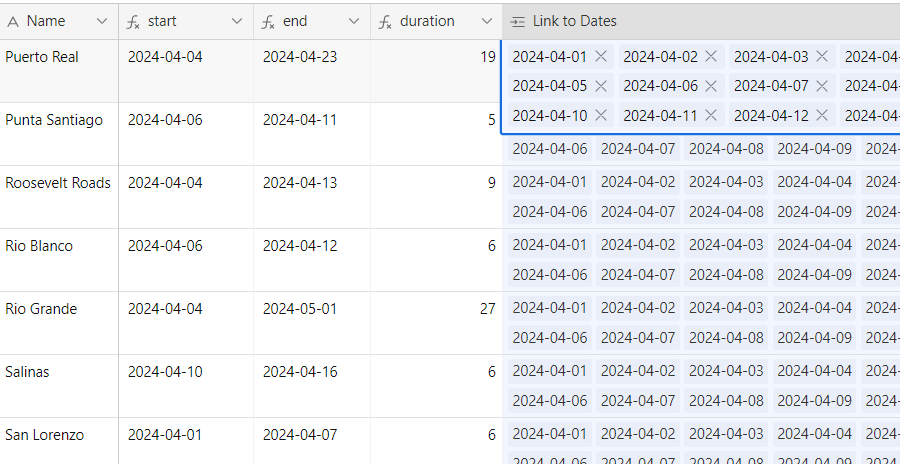
So, all workers will be linked to all dates
Alexey_Gusev_4-1713322311790.png

btw, add duration field, 

DATETIME_DIFF(end,start,'days')

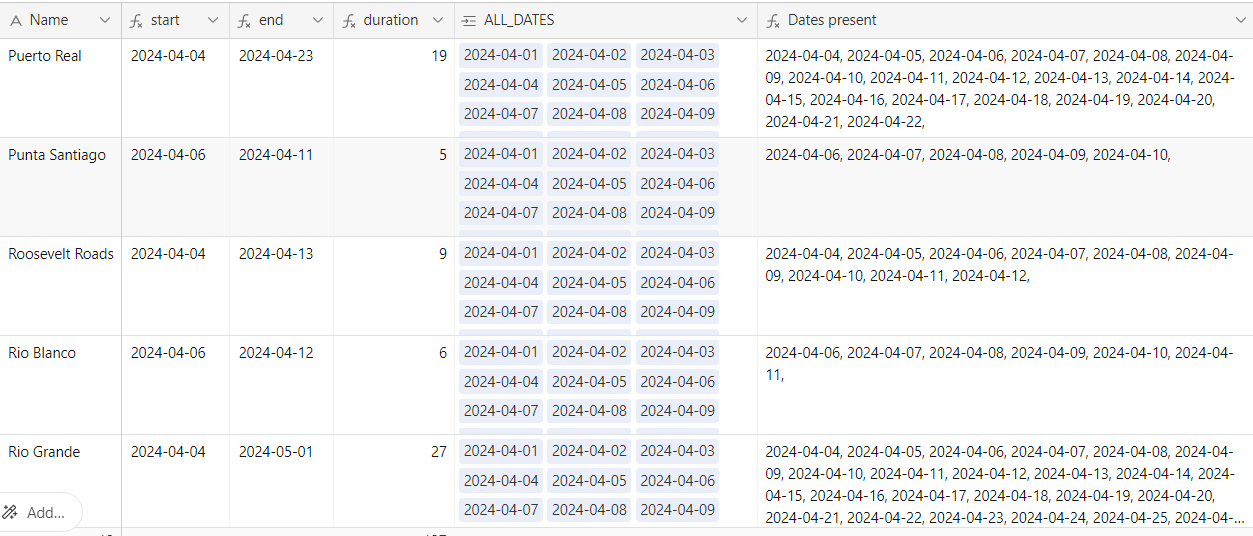
Now, make formula to extract interval. I renamed 'Link to Days' to ALL_DATES to avoid mess in formula. So, we will find  {starting date} and take that part, up to {end date}
At first, I did complex formula with FIND {start}, ALL_DATES  and FIND {END} etc, but then realized function MID needs start position and char count. it doesn't need end position. And chart count can be taken from {duration},  ISO date is always 10 chars, plus comma and space. SO:

MID(ALL_DATES,(FIND(DATESTR(start),ALL_DATES)),12*duration)

looks nice:

Alexey_Gusev_6-1713323700962.png

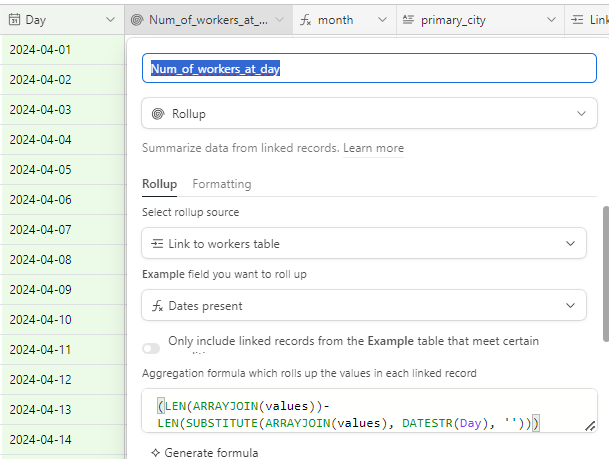
And the last thing, find how much given string included in a whole text (ROLLUP of Dates present). Substitute all occurences by '' , Substract LEN froma LEN of full text. Divide by the length of given string (10 in our case)
Alexey_Gusev_7-1713324061215.png


(LEN(ARRAYJOIN(values))-
LEN(SUBSTITUTE(ARRAYJOIN(values), DATESTR(Day), '')))/10


The advantage of this solution is ability to scale at any list of workers and list of dates, the only thing to be provided is correct linking - formulas will do the rest.  Of course, if you take whole year and a list of 1000 people, such amount of links/formulas might crush the performance or hang the table.
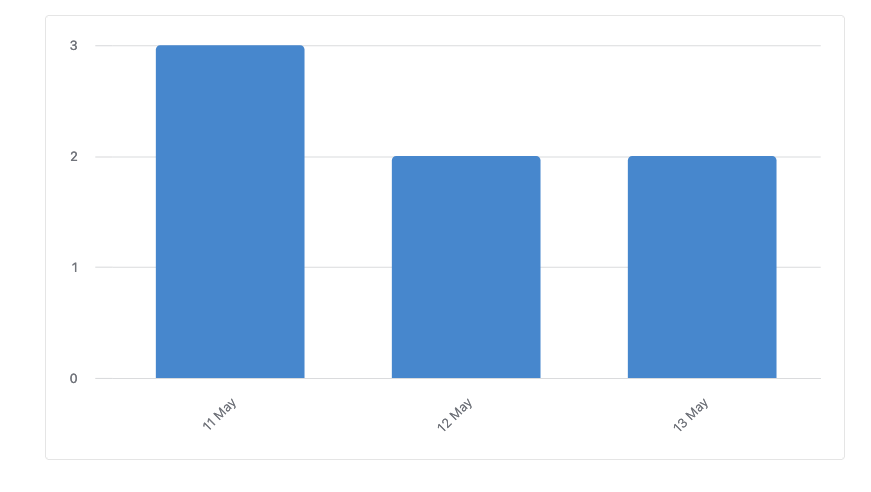
But that's another story, and now chart can be created:
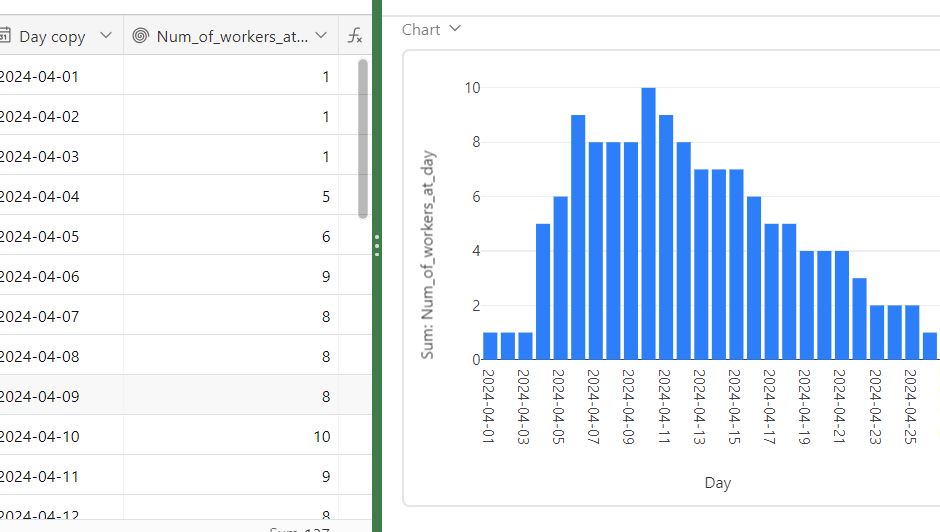
Alexey_Gusev_8-1713324393097.png


See Solution in Thread

4 Replies 4

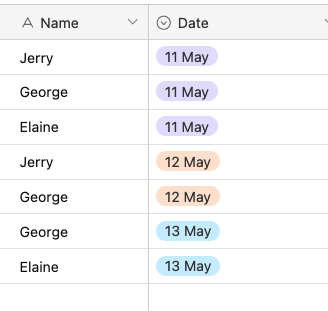
Hmm, I think you're going to need to manipulate the data so that it can be fed into a bar chart I'm afraid:

Screenshot 2024-04-16 at 8.48.27 PM.png

Screenshot 2024-04-16 at 8.48.18 PM.png

Alexey_Gusev
12 - Earth
12 - Earth

Hi,
Your approach is not good, because you need to create extra field for every next day.
Better solution is to create the table of days. You can put first date in the primary field of the first record, then put next day in the second record,
then select these two cells,
then click on little square at right-down of the cell and drag it down to the number of days you need

Alexey_Gusev_0-1713321841218.png

Link this table to a table of workers. Create link field, then add first worker, then copy the cell and paste it to whole field. (I just took random table of values and 30 days of this month, to act as test data) 
Ctrl+C

Alexey_Gusev_1-1713322087450.png

CTRL+V

Alexey_Gusev_2-1713322128650.png

And now switch to workers table and do the same:

Alexey_Gusev_3-1713322244336.png

So, all workers will be linked to all dates

Alexey_Gusev_4-1713322311790.png

btw, add duration field, 

DATETIME_DIFF(end,start,'days')

Now, make formula to extract interval. I renamed 'Link to Days' to ALL_DATES to avoid mess in formula. So, we will find  {starting date} and take that part, up to {end date}
At first, I did complex formula with FIND {start}, ALL_DATES  and FIND {END} etc, but then realized function MID needs start position and char count. it doesn't need end position. And chart count can be taken from {duration},  ISO date is always 10 chars, plus comma and space. SO:

MID(ALL_DATES,(FIND(DATESTR(start),ALL_DATES)),12*duration)

looks nice:

Alexey_Gusev_6-1713323700962.png

And the last thing, find how much given string included in a whole text (ROLLUP of Dates present). Substitute all occurences by '' , Substract LEN froma LEN of full text. Divide by the length of given string (10 in our case)

Alexey_Gusev_7-1713324061215.png


(LEN(ARRAYJOIN(values))-
LEN(SUBSTITUTE(ARRAYJOIN(values), DATESTR(Day), '')))/10


The advantage of this solution is ability to scale at any list of workers and list of dates, the only thing to be provided is correct linking - formulas will do the rest.  Of course, if you take whole year and a list of 1000 people, such amount of links/formulas might crush the performance or hang the table.
But that's another story, and now chart can be created:

Alexey_Gusev_8-1713324393097.png


emsone
5 - Automation Enthusiast

Dear Alexey!

Thanks for the elaborate answer. This does the job. I was hoping to deal with this issue within the given table rather than creating a new one. There are a few hundred workers already registered and creating the links to the new table manually is not an option. I know an automation will do the job. It's just a bit more of a hassle than originally expected 😉

Thanks again for your help and for pointing me in the right direction.  

Best regards
Henry

There are a few hundred workers already registered and creating the links to the new table manually is not an option. I know an automation will do the job. It's just a bit more of a hassle than originally expected 

I feel that my solution is not the best and the task can be solved in some easier way.
But it's usual approach when you need to count totals, or create a pivot table or something like it. Formulas can do calculations within their rows, in 'horizontal' way, but for 'vertical' operations you need a linked table, because records in a single table 'doesn't know about each other'. 
I often do complex inter-table connections and no matter how much records are in tables, it's just two copy-paste operations needed to connect them all.
My switch to workers table and do the same means 'select one worker with all dates linked, copy linked cell by Ctrl+C, select the whole column and do the paste by Ctrl+V' so it will link all dates to all workers.

But of course, if your case includes possible new workers, thing become harder, as every new record must be connected by link in the same way as others.
Anyway, I'm glad it helped you.