Hi, I have a table that connects pairwise my data in a kind of graph structure. Is it possible to implement a (recursive or not) depth-first search algorithm that will filter the connected records only for a given cell value?
Depth-First Search (DFS)
Best answer by Bill_French
Not internally in Airtable (as far as I know). I believe the formula support required just isn’t there.
The challenge with graph representations is that we need to transform the data using an array of vertices and a two-dimensional array of edges. I don’t believe this is at all possible in the current formula environment of Airtable. And to be fair, this is not really the domain of Airtable. Your question drifts into the data science segment, a place where stringent and performant tools are required.
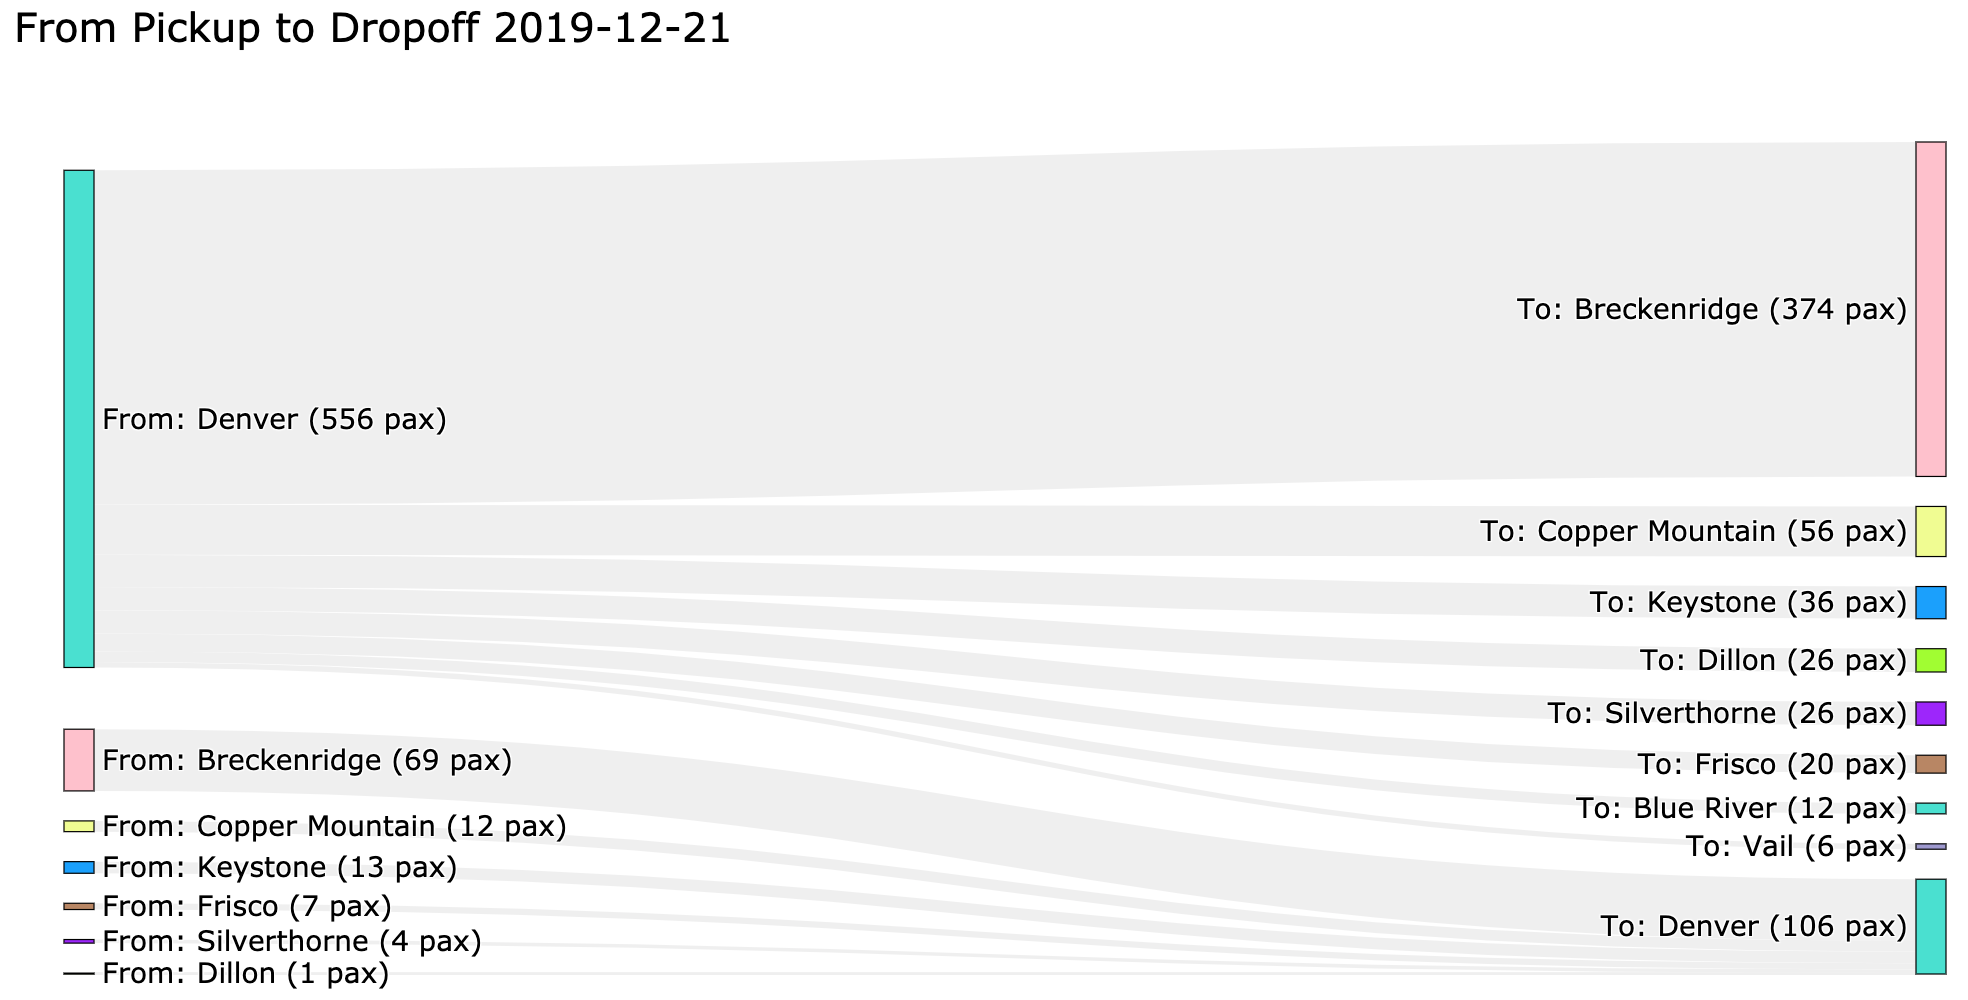
But it is possible to extract the Airtable data into an environment that can process the data as a graph using the Airtable API. For example, using Python and Streamlit.io I was able to provide a client with an interpretation of their reservations data for passengers booked on shuttles to and from DIA and Breckenridge, Colorado.
The reservations data is simple and very flat. But transforming it in Python (pandas) was relatively straight-forward. Rendering it with Streamlit became laughably simple, something few people have ever uttered in the history of Python. :winking_face:
Taking this to the next level - search - is a matter of applying the data using a full-text hash. Something like Whoosh could be used with Streamlit.

Enter your E-mail address. We'll send you an e-mail with instructions to reset your password.

