Help

Cumulative chart projects tracking over time

1266 4
cancel
Showing results for 
Search instead for 
Did you mean: 
Hidro01
6 - Interface Innovator

hello,

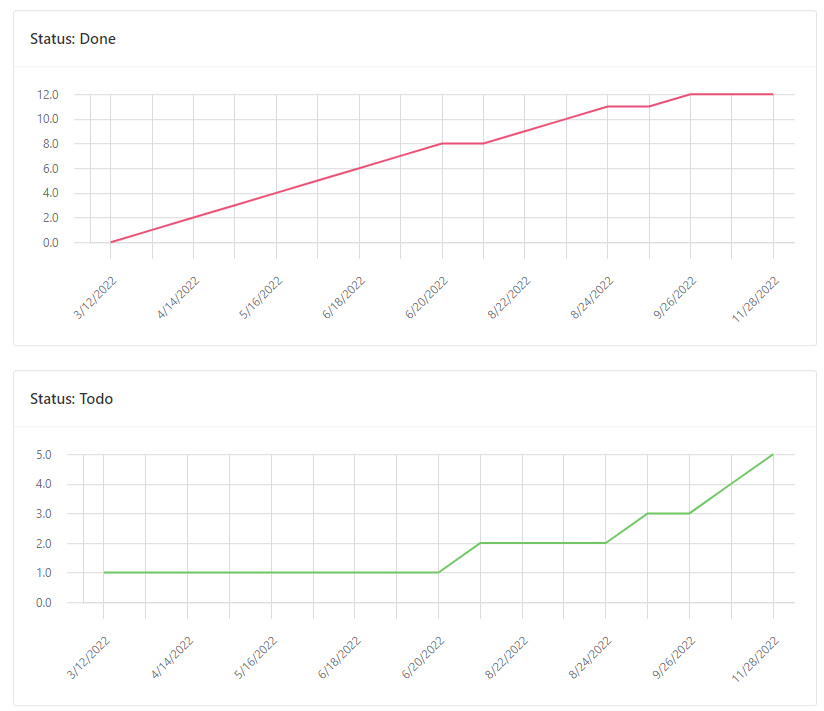
I have a project tracking tool in airtable and am trying to track project status over time. basically a cumulative chart of projects open and closed over time, something similar to this:

Hidro01_2-1687875918979.png

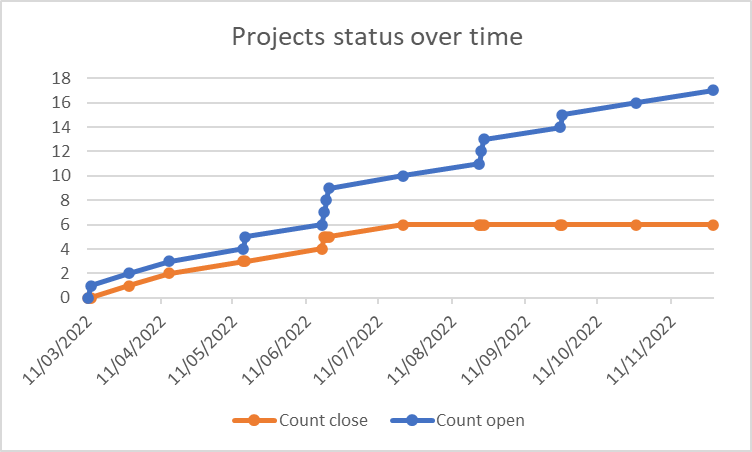
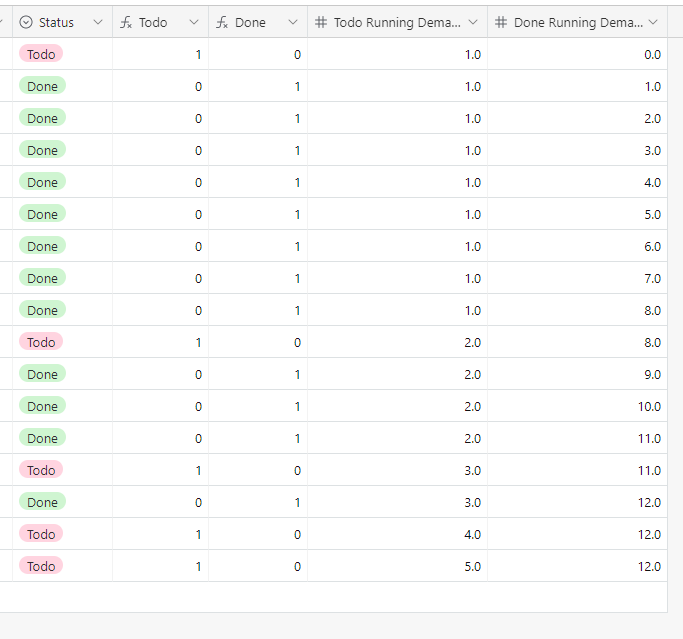
Basically, I need a collum with time another with running totals for open projects, and another for closed projects, and then chart these. Ideally, I would love to have this in an interface chart.

is there a way to achieve this, I have seen similar questions but so far I have not seen a straightforward answer.


4 Replies 4
Tom_Glatt
6 - Interface Innovator

You could use a separate Status table to track status changes rather than what is most often used - a single select status option within the same table as the projects themselves. In a Status table, which would be connected to your Projects table with a lined record field, you would have fields along the lines of:

  • RecordID (autogenerated number)
  • Status (single select options)
  • Date stamp
  • Project (linked record field to projects)

You can then chart off of the Status table rather than the projects table. With lookup fields you can pull into the Status table any number of fields that are in your projects table (current status, etc.).

We use something similar to track project notes and also our project invoice schedule. 

Hope that helps.

Hmm, the only sure thing I can tell you is that you'll probably need a separate table where each record represents a date range of one month and chart off of that; how the data gets populated after that depends heavily on your workflow

For example, you could potentially have an automation that runs once a month and its actions will be:
1. Run a "Find Record" action looking for all the projects that are closed
2. Run a "Find Record" action looking for all the projects that are open
3. Create a new record in the table where each record represents one month with the counts from steps 1 and 2

Hidro01
6 - Interface Innovator

Thank you. 
I was trying a simpler solution, although not perfect and not exactly what I had in mind.
I implemented a running total script that does the work of calculating cumulative totals, from additional columns that count status.

Hidro01_1-1687939750048.png

However, since Airtable doesn't support building stack charts by adding more than 1 column of data I have to plot in 2 separate charts and not in a single chart.
Would there be a workaround? 

Hidro01_2-1687939903261.png


Thanks for your reply, I see what you mean, something like this?

Project table:

Hidro01_3-1687940545669.png

Status Table:
Hidro01_4-1687940570982.png

But how do I get the cumulative total through the time chart? If I chart the status table I just get the totals and I lose the date dimension, no?