

Hi there,
We currently have a candidate pipeline interface that looks like this:
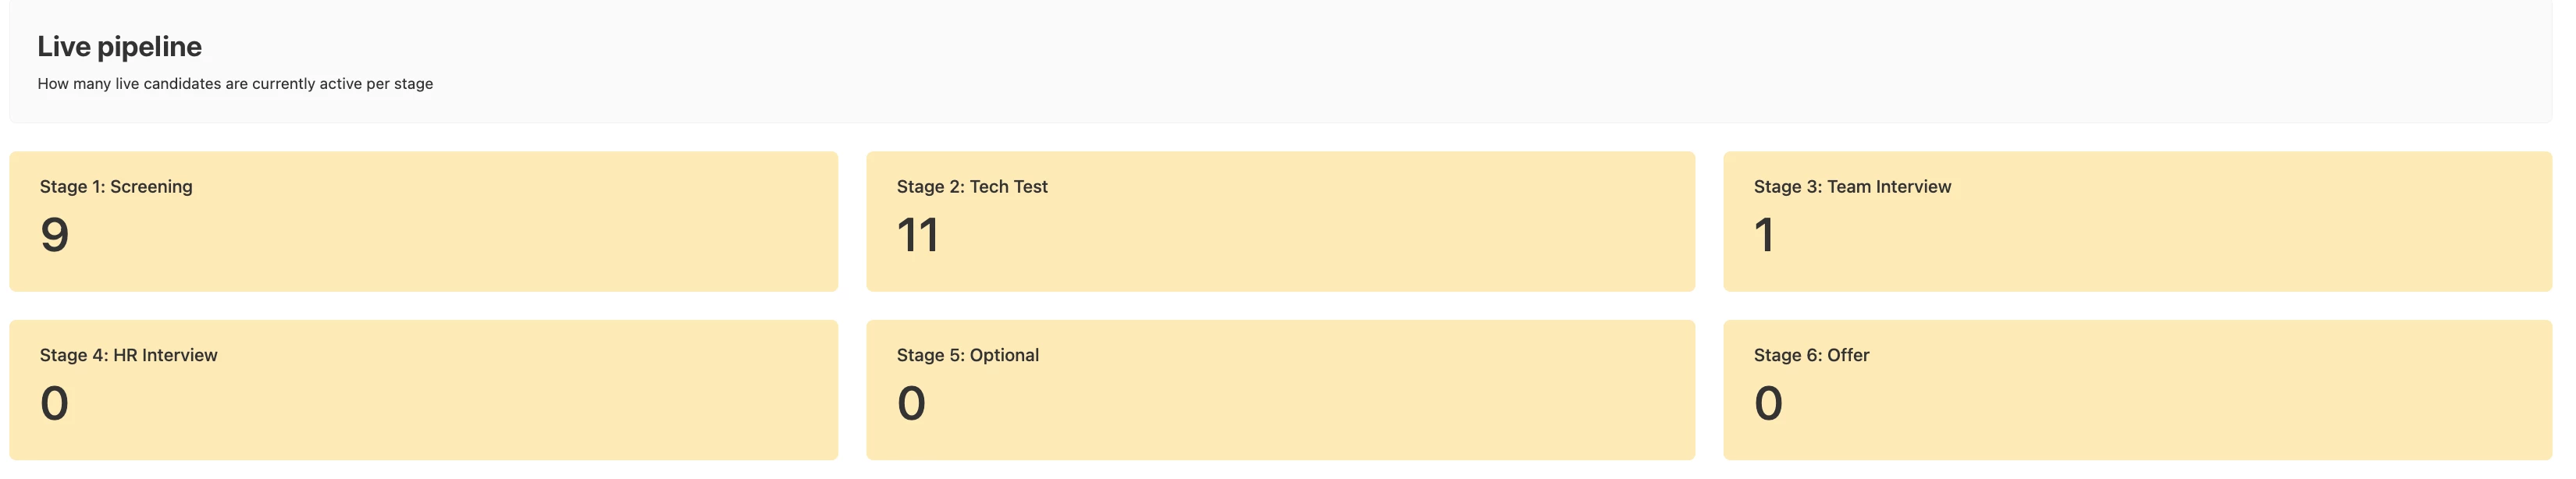
The numbers are based on a formula that outputs the stage based on the latest date set, so the 11 candidates in stage 2 all have the latest date added as 'Stage 2 start date'. As soon as we add a date to a candidate to 'Stage 3 start date', it will add take 1 of stage 2 in the interface and add 1 to stage 3.
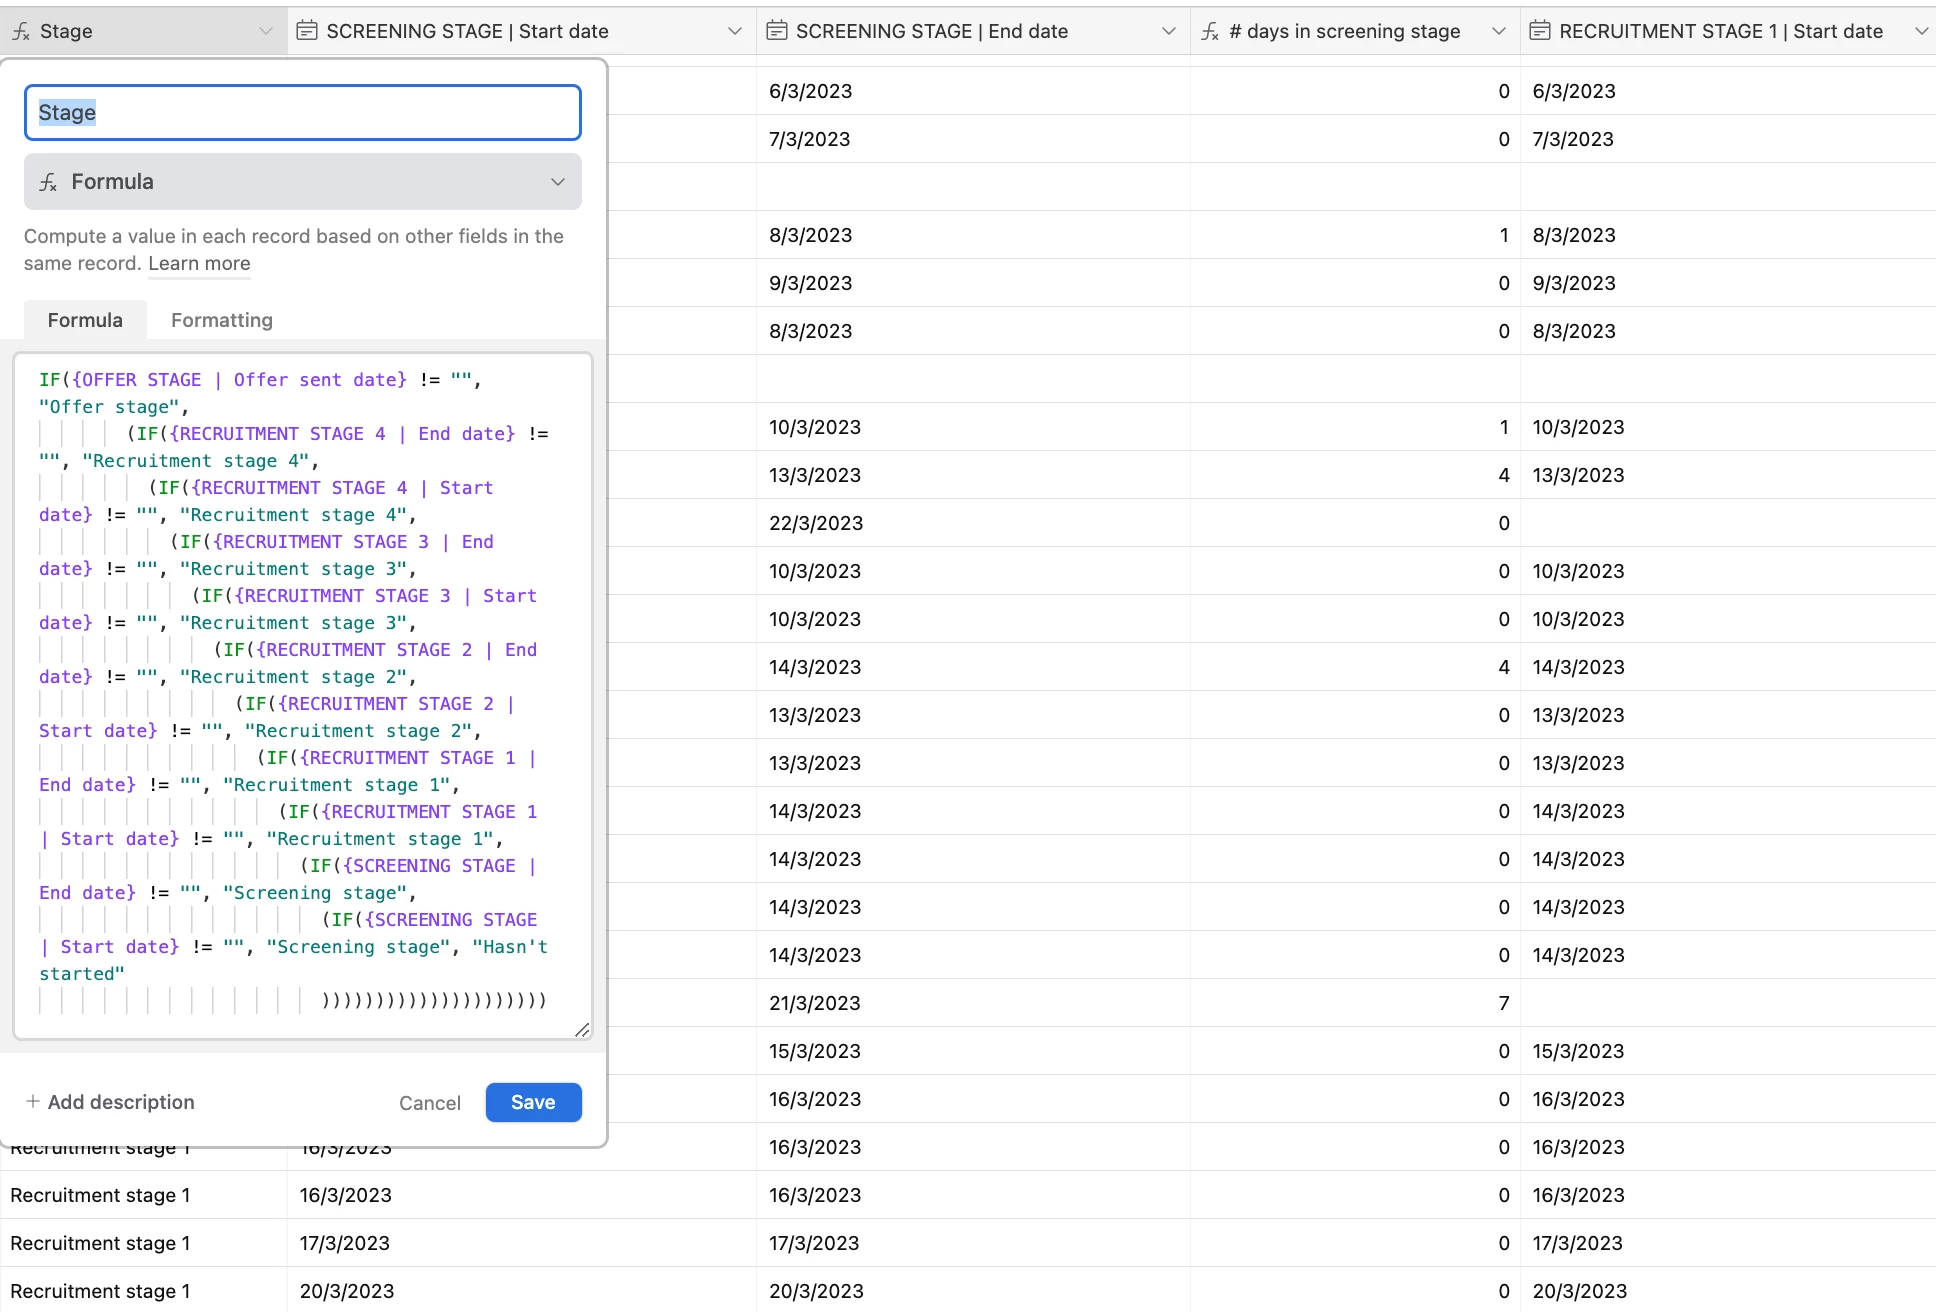
Here's the database view of that, where you can see the formula and the some example date fields:
This works well, but: now we want to be able to add a filter where we select a date, displaying the pipeline from that date, so how many candidates on that day were in each stage.
Does anyone have a clue how to get this, let's say, historical snapshot view of the pipeline?
Thanks in advance!