Help

Depict different "phases" in Timeline View?

Topic Labels: Views
1759 2
cancel
Showing results for 
Search instead for 
Did you mean: 
FaH
5 - Automation Enthusiast

Hi all,
I would like to depict different Date ranges in the timeline view (e.g. like this example pic from Excel):
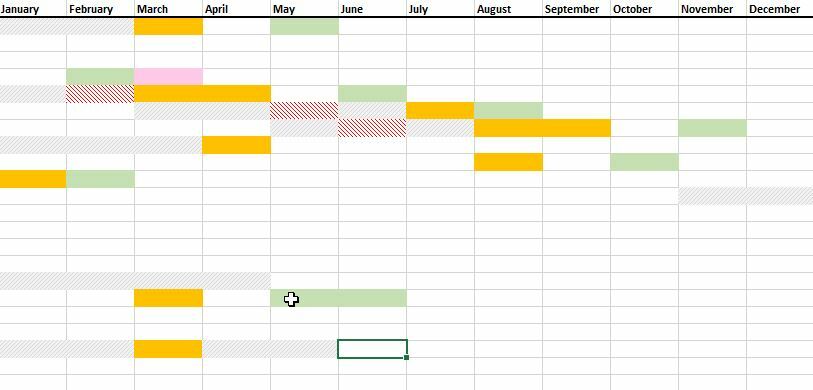
2021-11-23 18_40_45-Window

However, I struggle to find a solution. I do not necessarily need the timeline view but I have a lot of projects who all have the same setup (x different stages with follow in a more or less defined sequence):
2021-11-23 22_07_55-Window

Does anyone have an idea how to realize such an overview? Dividing each project into 5 subcategories and then using a Ganttchart seems to be extremely labor intensive.

I would even be happy if I could have a simple continous timeline from start to end as offered today with milestones depicted in between at dates X, Y and Z. Like this example:
2021-11-23 22_14_55-Window

I feel like I am missing something as all the options I have tried/thought of are either not working or adding extreme complexity to the workspace.

Thanks!

2 Replies 2

Timeline and Gantt views plot a single start date and a single end date for records (or only one date for milestones).

I assume you have a table of Projects. To do what you’re requesting, you likely need a table of Project Phases. If Project A has 5 phases, then it should have 5 records in the Project Phases table.

FaH
5 - Automation Enthusiast

Hi Kamille,

thanks for your fast reply. So if I have 50 Projects, I’d need 5 x 50 records in a Project Phase Table as each Phase has different dates for different projects? That really seems very laborious for my people to maintain.