Help

Percentage Completion of multiple records in Interface

2842 4
cancel
Showing results for 
Search instead for 
Did you mean: 
DanielP
6 - Interface Innovator

I have a question very similar to the one posted in How can I add percentages to airtable dashboards?.

I have a table with 50 rows (per company), each of which has a projectComplete Y or N. In my interface I have 2 numbers elements that count the total number of Ys and Ns. Let’s say those numbers are 10 Ys and 40 Ns. I’m trying to figure out how exactly to produce a number or chart that will tell me that the overall Y completion percentage is 20%.

Surely there must be a way to do this in the interface screen without some hack that adds a new column to your dataset? Even if the only answer is a hack I can’t really see how I could construct that in my dataset. Thanks for any thoughts!

4 Replies 4

Hi @DanielP,
Is your Main table linked to a projects table?

If so you can roll up the number of completed projects and divide that by the count of total projects divided by 100 to get the percent complete per company to display on your interface.

Hi @Vivid-Squid, No there’s no separate projects table - just a companies table with a projectComplete flag. Even if I just plot a chart in the interface using the projectComplete flag, for some reason something like a donut chart will only display percentages as a hover behaviour instead of a permanent label.

Is creating a brand new linked table the only way to display something as simple as a “percentage complete”?

The only other idea I had (which seems very over-engineered and clumsy) would be to create an automation that reacted to changes in the projectComplete field and populated a new field called projectCompletePercentage which could then be summed up in the interface.

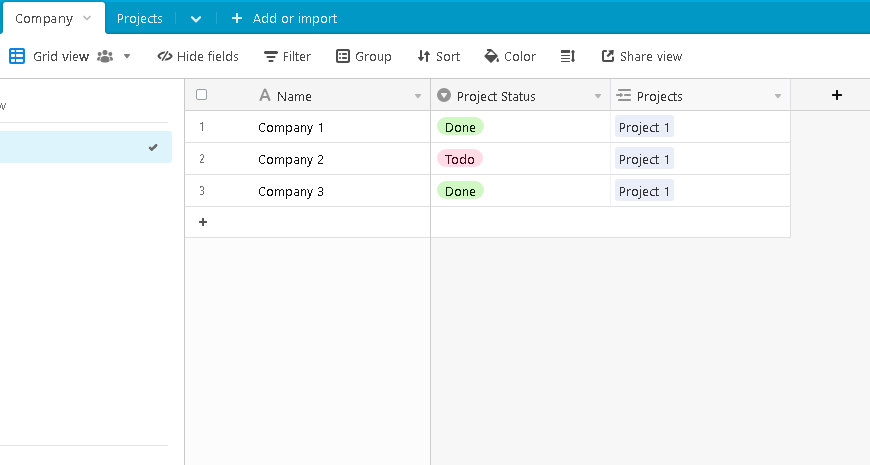
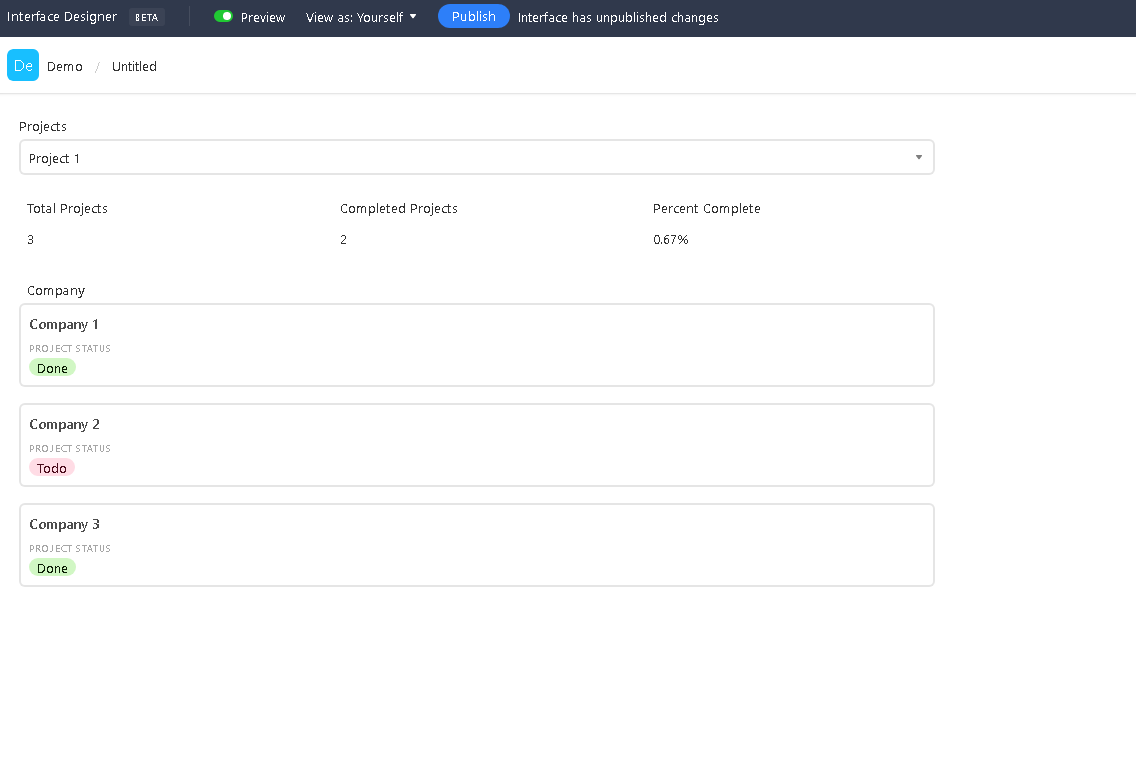
There may be a better way to do this, but here is how I have it in my head. Two Tables, Company and Projects linked

On the Projects table, added a count field for total projects, a count field for completed projects and a formula for percent complete.

Then added to interface

image

image

image

thanks for taking the time to demonstrate that so clearly - I can see how it would work, but the issue is that I only have 1 project, and so creating a brand new table feels really over-engineered and potentially confusing for users wondering why that table (and the linked fields) exist. It’s a shame I can’t hide that largely redundant table (in the same way you can have a personal view), because otherwise I just don’t think the solution is worth cluttering my base with. I only hope they expand the interface soon to allow such a simple reporting use case to be supported.