Hi there,
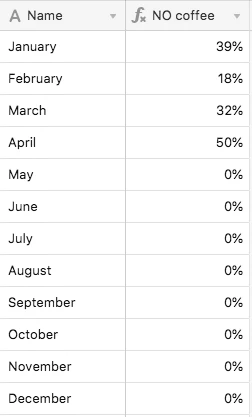
I’m trying to gerryrig a pivot table type situation. Basically I made a habit tracker and I want to keep a monthly log of how many of each habit I tracked that month (ideally by percentage but willing to do it by number). I have it set up so that each day is the “Name” of the record and each column is a habit with a check mark. I know check marks are supposed to equal 0 and 1 in terms of formulas but I was trying to use Ifs to make it conditional so that it would tell me the count for each month (ie If({Month #}={Month}, Sum({NO coffee})) with both Month # and NO coffee being from the main table that I’m trying to summarize. Everything I’ve read in the documentation seems to indicate you can cross-reference columns from the table you’re rolling up and yet those options don’t show up when it pre-populates options for the formula. I know I can technically view all this just through filters and grouping but I was hoping for something cleaner that would be easy to visually see improvement.