- Mark as New
- Bookmark
- Subscribe
- Subscribe to RSS Feed
- Permalink
- Report Inappropriate Content
May 06, 2019 01:05 PM
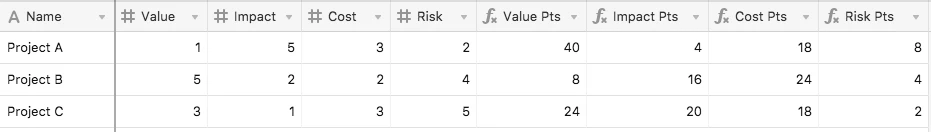
In table 1 I have calculations for categories value, impact, risk and cost of each project on a scale of 1-5 each
In table 2, I have the total points possible for each of those categories (Value = 40, Impact = 20, Cost = 30, Risk = 10)
In table 1, using the 1-5 value in each calculated category, I want to calculate a % of points possible depending on the value
1 = 100%
2 = 80%
3 = 60%
4 = 40%
5 = 20 %
Any thoughts on how to link the tables to do this?
- Mark as New
- Bookmark
- Subscribe
- Subscribe to RSS Feed
- Permalink
- Report Inappropriate Content
May 06, 2019 03:15 PM
Welcome to the community, Wendy! :grinning_face_with_big_eyes: If those category values are going to remain fixed, this would probably be easier to bake them into a formula, rather than pull them from a second table. (The latter is doable, but baking them is much easier.)
Here’s a quick example I threw together:
The formula for the {Value Pts.}
field is this:
((100 - (Value - 1) * 20) / 100) * 40
For the others, just replace “Value” with the new category field name, and the final number with the max for that category.
Does this get you what you want?
