Hi there.
For a while I have been trying to figure out the following. Maybe you can help.
For our participants we measure there progress over time. We do this by filling in a form about every 2 months.
We have one base with all the participants (personal data).
Since one participant can follow multiple trajectories, we have one base with all the trajectories linked to the participants.
The results of the form also appear in a seperate base. For everytime the form is filled in, a new row is created (which is linked to the right trajectory)
My question is the following:
Example:
On 1-1-2023 John scores 6/10 on our communication scale.
On 1-3-2023 John scores 7/10 on our communication scale.
On 1-5-2023 John scores 8/10 on our communication scale.
On 1-7-2023 John scores 7/10 on our communication scale.
On 1-9-2023 John scores 9/10 on our communication scale.
On 1-1-2023 Cristia scores 4/10 on our communication scale.
On 1-3-2023 Cristia scores 4/10 on our communication scale.
On 1-5-2023 Cristia scores 5/10 on our communication scale.
On 1-7-2023 Cristia scores 6/10 on our communication scale.
On 1-9-2023 Cristia scores 6/10 on our communication scale.
And way more people...
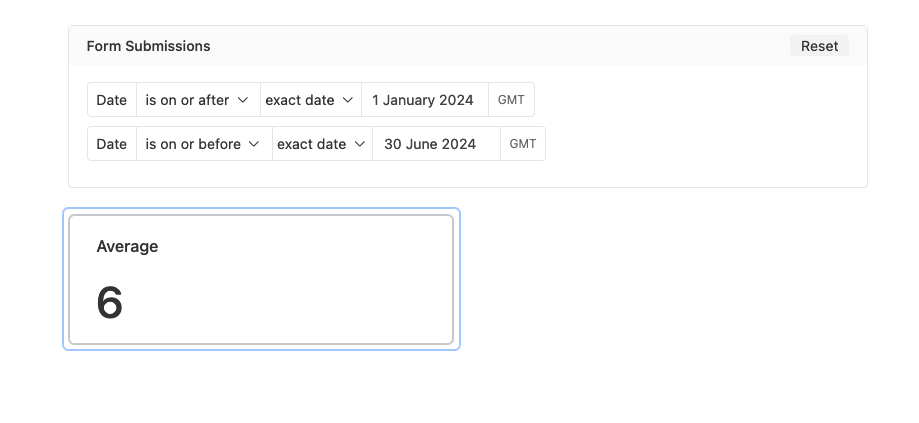
I would like to create a dashboard where our stakeholders can see what progress is being made on a organisation level (so not per person, since they are not allowed to see all the personal data).
So which fields should I create to obtain the right data for a dashboard where a stakeholder can fill in:
Give me the average progress on Communication in the first half a year of 2023.
The main fields are:
- Date where the form was filled in
- Name participants and trajectory
- Score communication (and other fields, but for the example one is enough)
(I've already worked with first and last measurements via a rollup, but this is not sufficient, since sometimes the first measurement will be outside of a timeframe which results in wrong data)
I look forward to hear from you!