Hello! I am attempting to recreate some data I have in Google Sheet and improve my work flow. I am currently counting things by hand and it taking to long. What I am trying to do is create a "Master" sheet where all my info lives. But have a "Stats" table that will then automatically aggregate the data by Photographer and month. It would count the specific "Production Type" and sort it by "Photographer" and month. I have attached some screen shots. I have been trying to google it for days with not luck.
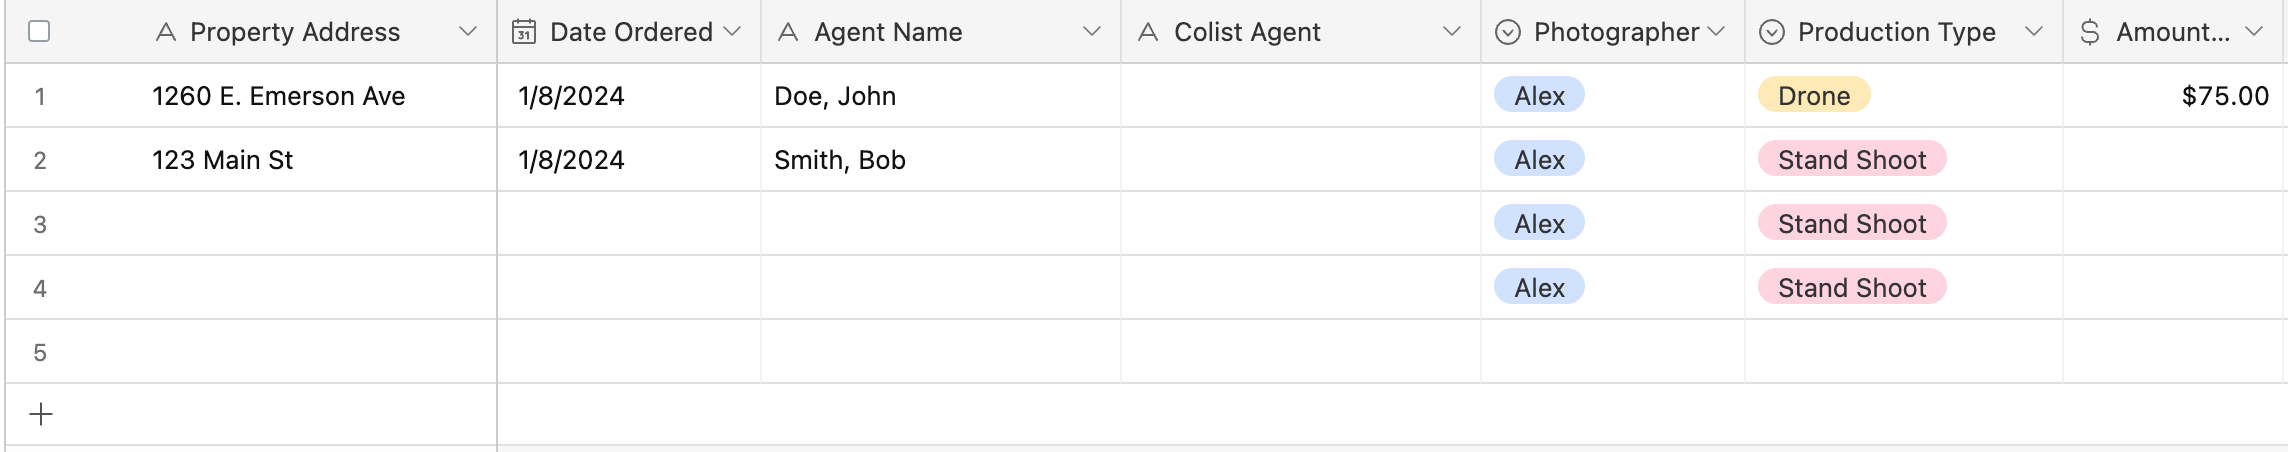
Here is the start to my "master" table
Here is my current "Stats" tables I have in Google Sheets:
By Month: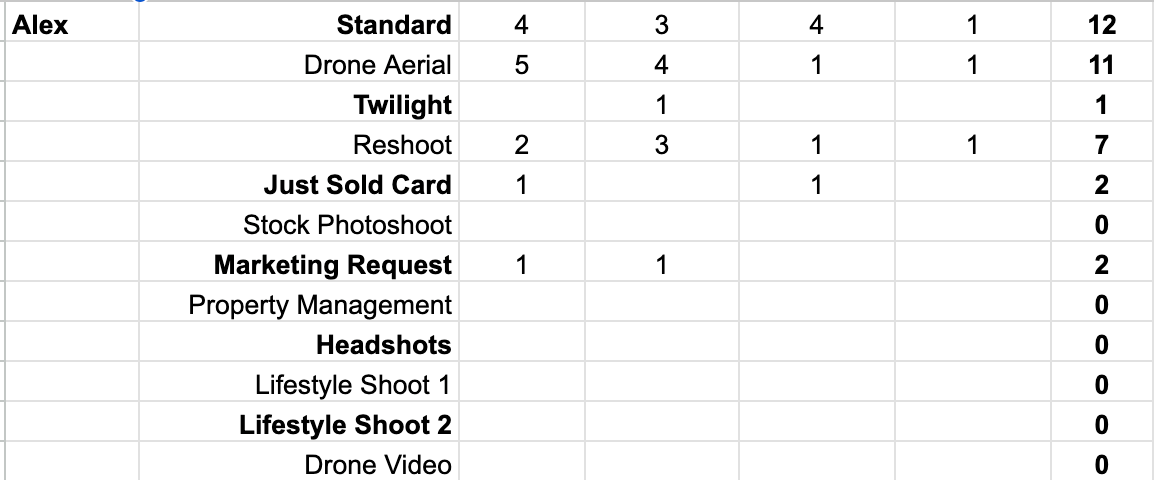
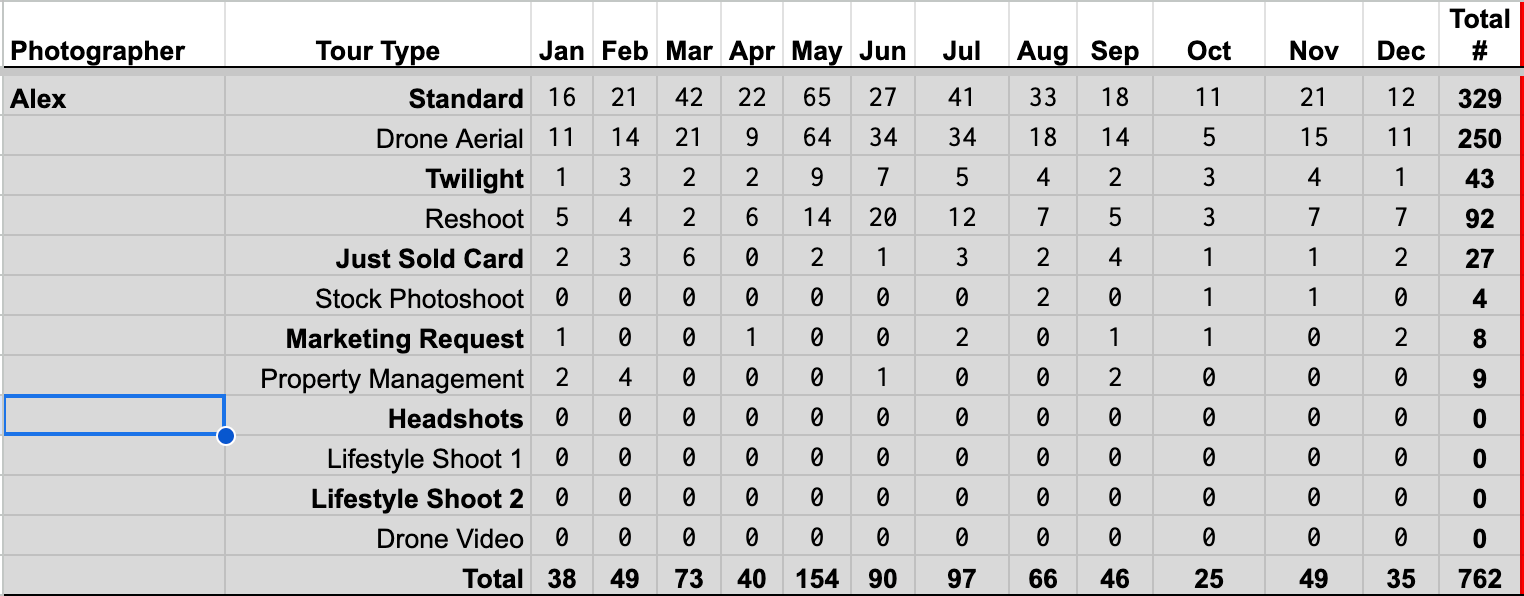
It then feeds into a yearly data sheet