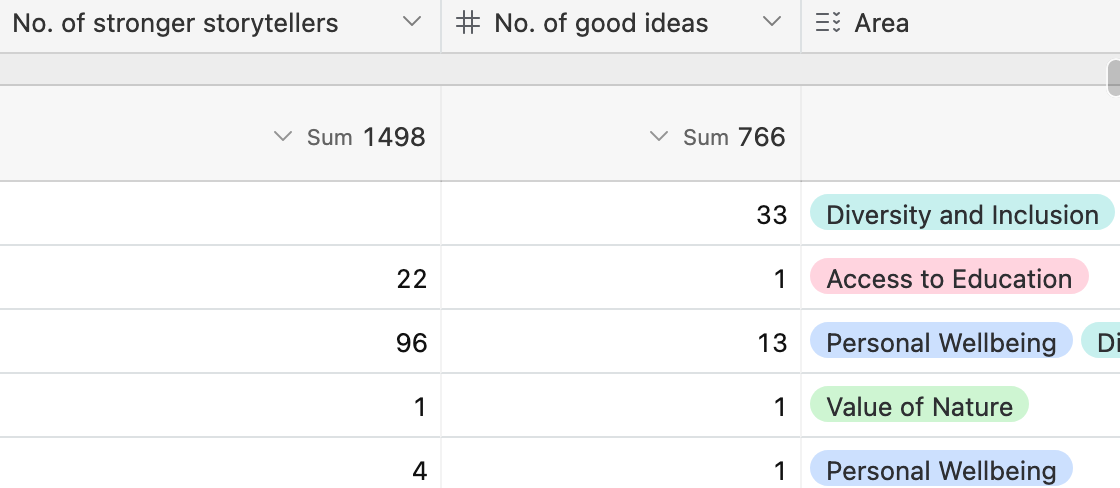
Hi! Any help with this would be greatly appreciated - I'm having a data vis problem in one of our table interfaces. We keep records of individuals we've helped (Stronger Storytellers) and the ideas we've helped grow (Good Ideas) and we tag each record with any number of our 7 impact areas.
I want to create a visual e.g. pie chart that shows the total number of Stronger Storytellers by impact area, and Good Ideas by impact area. Currently, rather than including every Stronger Storyteller (we have 1498 on record as of right now) it will total the number of records instead (currently 524) which means the visualisations don't accurately represent our impact areas. TIA for any tips on how to approach this 🙂
