Help

Re: Visualising Multiple Dates in Timeline View

Solved
Jump to Solution
2214 3
cancel
Showing results for 
Search instead for 
Did you mean: 
DanielP
6 - Interface Innovator

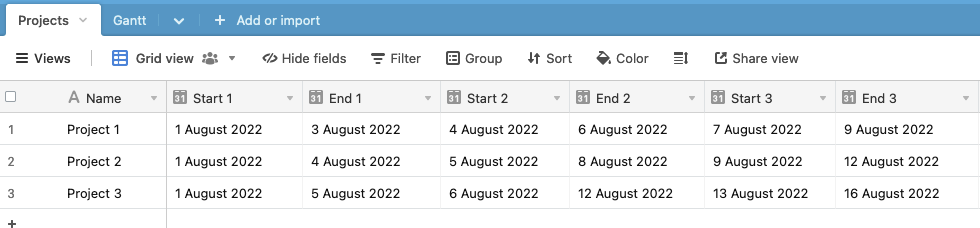
I have a table that looks like this…

CompanyName, CompanyID, AttributeA, AttributeB, Phase1Start, Phase1End, Phase2Start, Phase2End

In other words, 1 row per company, with lots of start/end date columns for multiple phases of a large project.

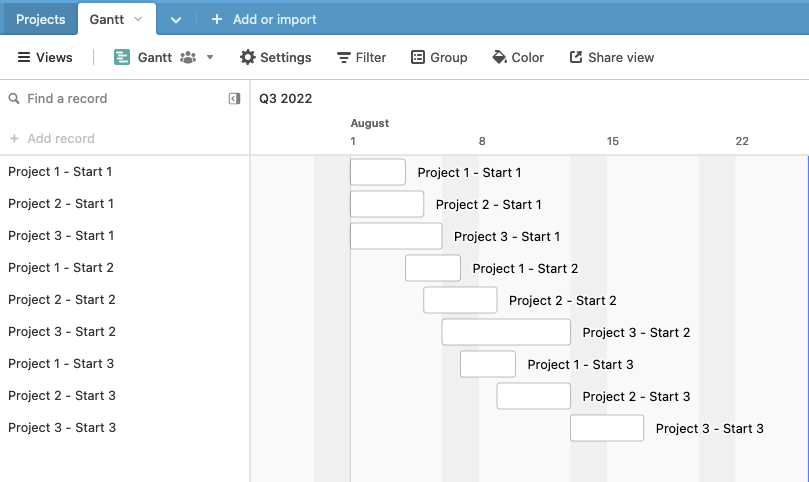
I now want to plot those phases with some kind of timeline view but am struggling to achieve this with Timeline or Gantt. Calendar view at least allows me to specify multiple input dates per row, but the view isn’t really appropriate for managing a project.

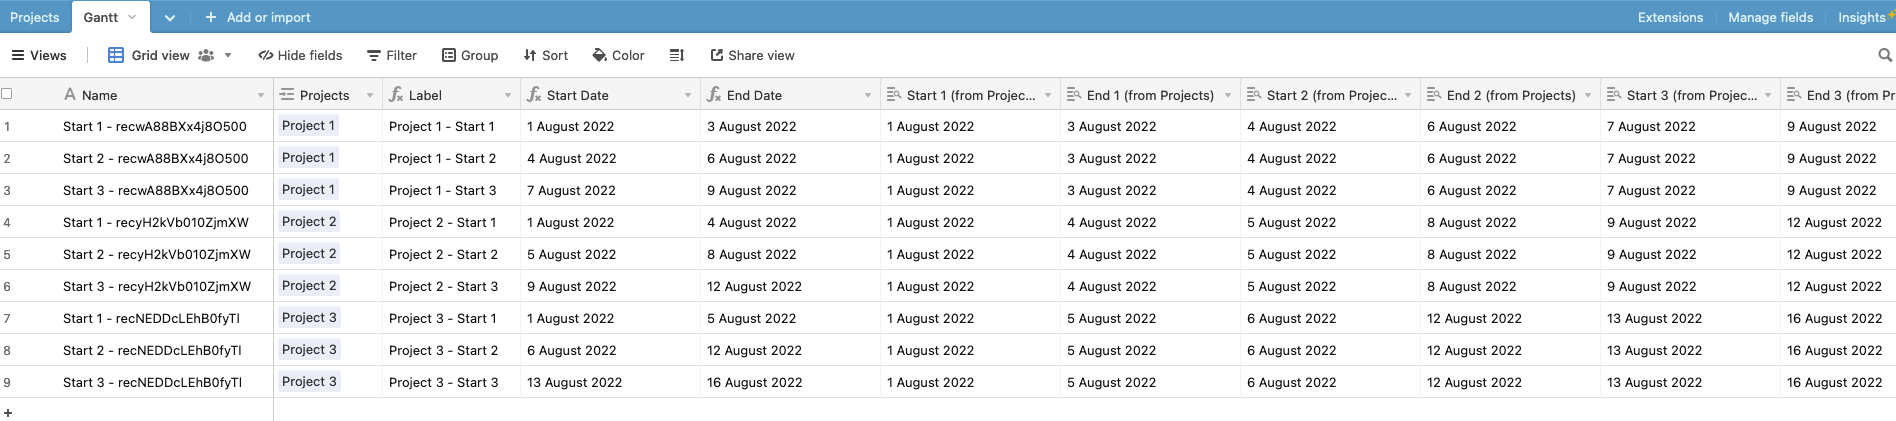
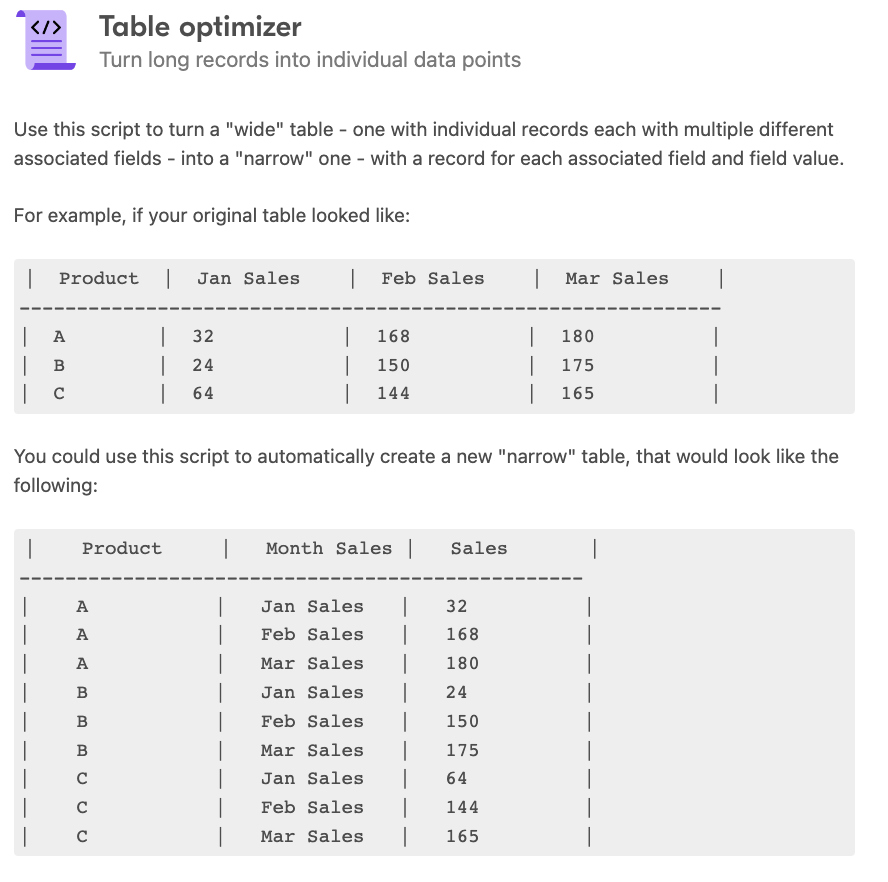
I can see one potential solution which is to create multiple rows in my data per company and then group the various rows by company in my timeline. But I really want to avoid doing this and dramatically messing up the structure of my initial base.

Has anyone else successfully plotted multiple phases of a project for a given row with a timeline view? Or even any other view that works well on project management? Thanks for any thought!

1 Solution

Accepted Solutions
TheTimeSavingCo
18 - Pluto
18 - Pluto

Hi Daniel, might I interest you in a hacky workaround?

Screenshot 2022-08-26 at 12.48.18 PM

Screenshot 2022-08-26 at 12.48.34 PM

Screenshot 2022-08-26 at 12.48.45 PM

Here’s a link to the base

It has an automation that runs basically whenever a new record gets created in the Projects table which creates new records in the Gantt table based on the number of start/end dates that we need

From there, the Start Date and End Date formula fields in the Gantt table determine which dates to show based on the name in the primary key, and we then use that for the Gantt view

It’s…pretty convoluted, but it’s automatic, syncs data fine, and works perfectly for my needs heh

You can duplicate the base to see all the formulas etc, lemme know if you have any questions

(You can also just hire me to do it if you don’t want to deal with all of this too!)

See Solution in Thread

5 Replies 5
TheTimeSavingCo
18 - Pluto
18 - Pluto

Hi Daniel, might I interest you in a hacky workaround?

Screenshot 2022-08-26 at 12.48.18 PM

Screenshot 2022-08-26 at 12.48.34 PM

Screenshot 2022-08-26 at 12.48.45 PM

Here’s a link to the base

It has an automation that runs basically whenever a new record gets created in the Projects table which creates new records in the Gantt table based on the number of start/end dates that we need

From there, the Start Date and End Date formula fields in the Gantt table determine which dates to show based on the name in the primary key, and we then use that for the Gantt view

It’s…pretty convoluted, but it’s automatic, syncs data fine, and works perfectly for my needs heh

You can duplicate the base to see all the formulas etc, lemme know if you have any questions

(You can also just hire me to do it if you don’t want to deal with all of this too!)

Thanks so much for sharing this. It does indeed enable me to construct the timeline or gantt view I was hoping for, although the one issue I see is that each time a new pair of start/end columns are added (I might have 20 of them), I’ll need to extend the formulas which will become messy and difficult to read pretty quickly.

I don’t mind the fact so much that I need a new table or automations though - it’s just the maintainability of this solution that worries me a little (even though it seems to be the only way to achieve the desired result so I’m accepting as the answer!) Thanks again

Yeah…not to mention the lookup fields that have to be created.

Hmm, I can imagine a script that could handle this for you without you needing to mess with formula fields or lookup fields. It would create new records as needed depending on the number of date fields were filled in and handle the updates etc

The downside would be that you’d have to get someone to write it for you / make changes in the future for you if you don’t know scripting yourself of course

oh interesting, when you say script, you mean your own custom/offline build that pushes data via the Airtable API? Or you mean the “extensions->build a custom extension” option and writing your own script?

Actually, based on your suggestion I just went through the standard scripts and found one that looks like a pretty good fit…

Screenshot 2022-08-27 at 10.56.50

Do these scripts have to be manually run each time you want to transform the table? Or can we automate them to run any time data changes?

Ah, I was thinking of an automation script. Here’s a link to the docs for it

Yeah that looks interesting. That’s a script that’s built to work with the scripting extension though, so you’d need to make some changes to it to make it work within an automation. Very doable