

The Problem I'm Having
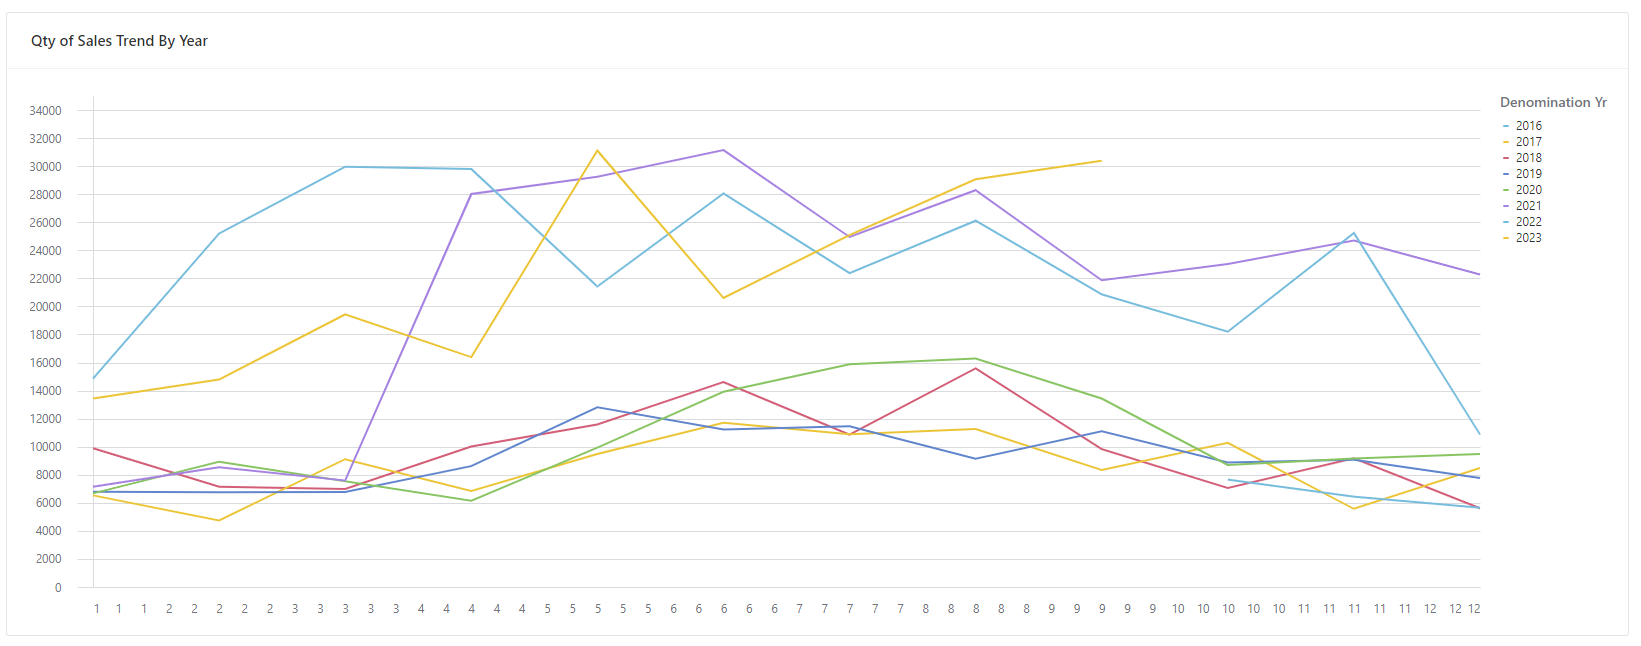
The below image will probably tell it best. I have a chart that appears to have duplicate x-asis labeling. Ideally, this data would have a single value per month, but it is duplicating upto 5 times for a given month.
What I've Done
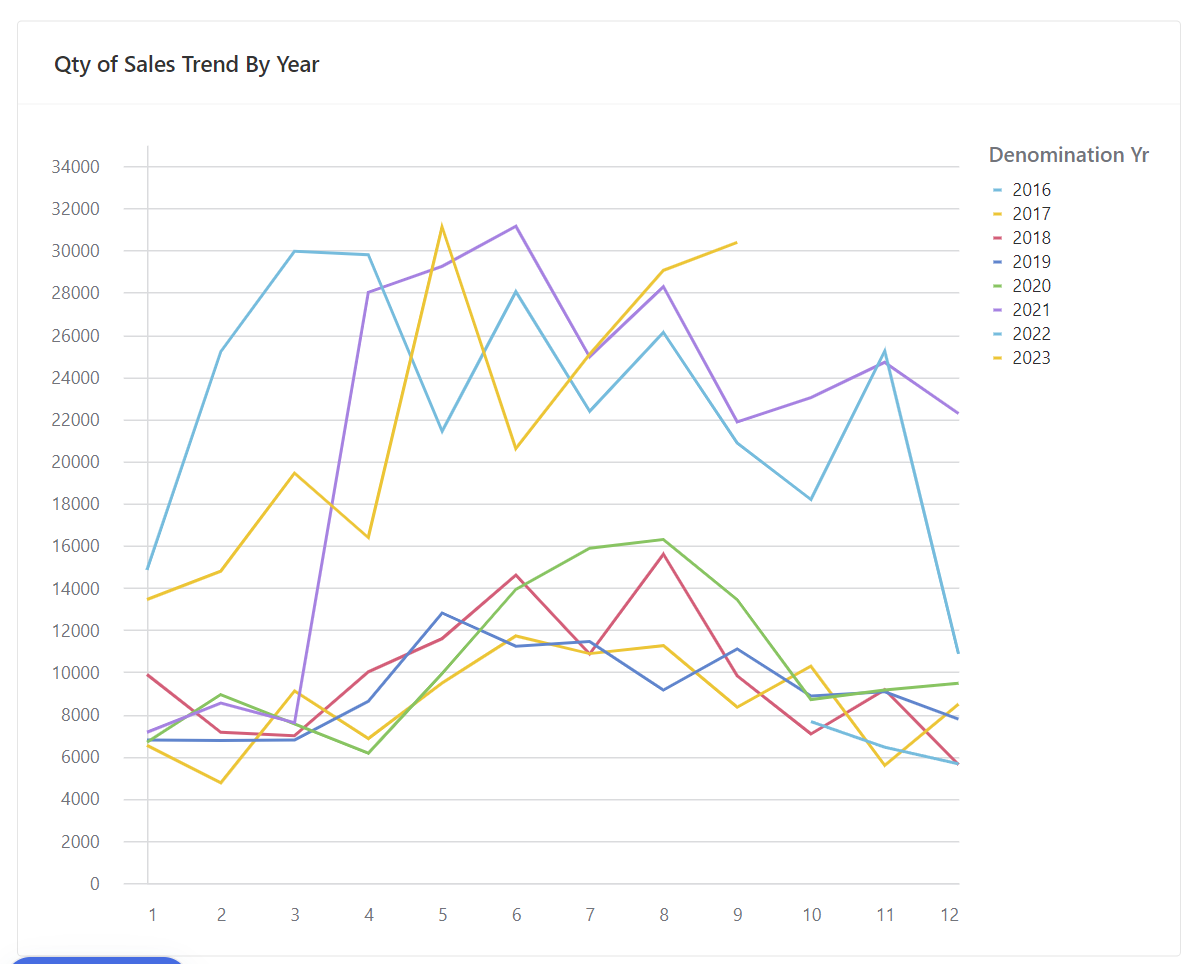
I suspect this may be a UI issue because when I scale my Chrome browser to 150x, I get a single x-axis value.
This solution doesnt work for me because I have multiple stakeholders who view this data, and explaining to them to fine tune their monitor until theyu get their desired row count just wouldnt work.
My Question
Besides adjusting the zoom ratio of my screen, are there any other solutions you can suggest? Thank you in advance!
