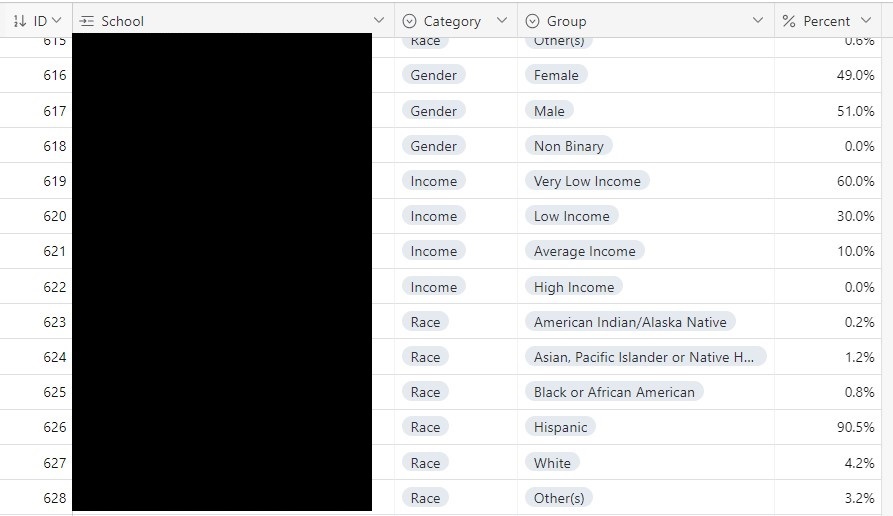
I have a list of schools and I'm trying to track demographics I have about the schools:
- race
- income levels
- genders
I have reports with the aggregate data, not the individual student records. Therefore I'm not able to do rollups but tracking each demographic for an individual students in a linked table.
What would be the best way to store the aggregate values, so that I can generate charts per school or across all schools? These categories have different amounts of choices too.