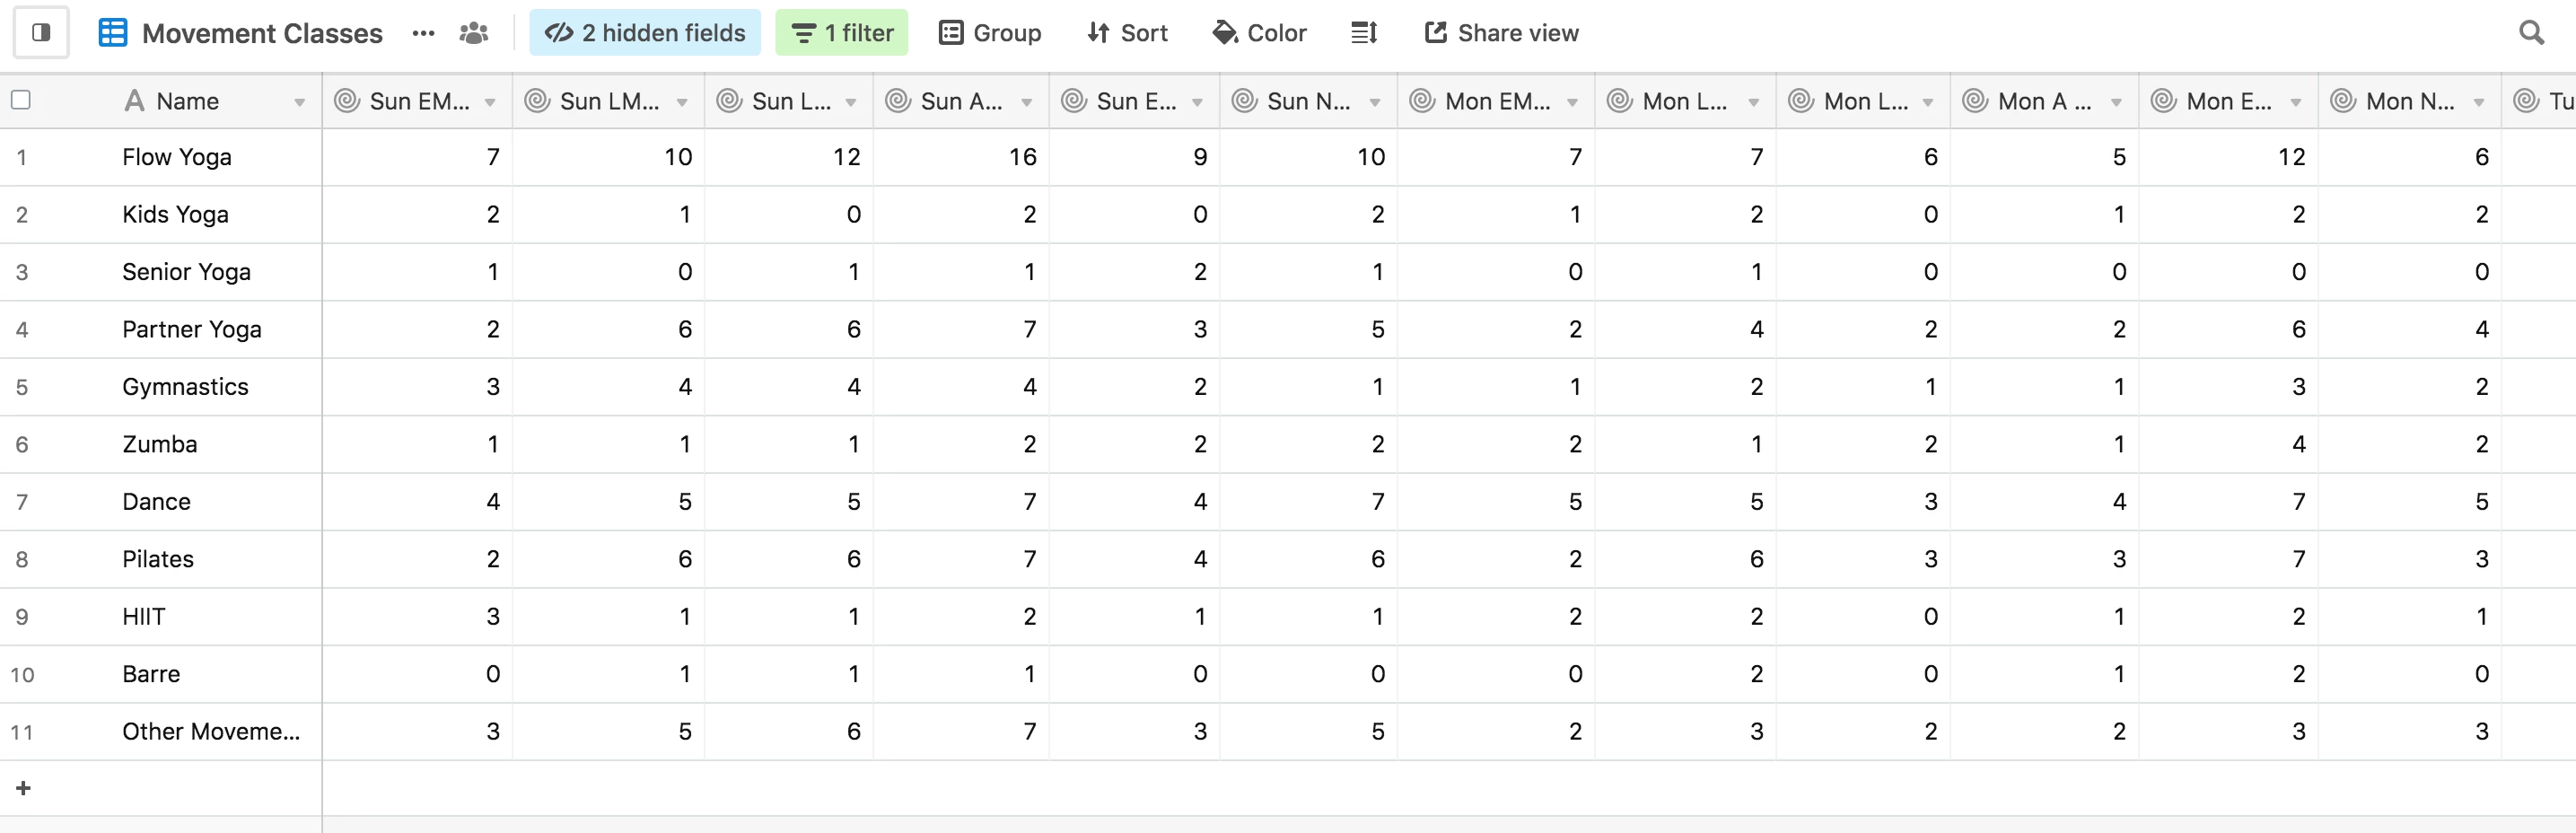
I don’t think you are - a chart (using the embedded chart app) is designed to utilize records as the basis for its data. This is a design choice that is often wrong.
In your case, you are ostensibly needing a spark line - a chart whose values are confined to each record and there may be away to trick the Vega-Lite chart block into doing this.
One of the challenges though will be selecting the context so that each class is viewable.
One idea, pivot the data 90 degrees then chart it.
Thanks @Bill.French!
Yes, it seems like I might need to switch things around and make the Class Days and Times the records and the Class Types the fields. But that still doesn’t make sense if I have to choose just one field for the x axis and one field for y… hmmm…
Thanks @Bill.French!
Yes, it seems like I might need to switch things around and make the Class Days and Times the records and the Class Types the fields. But that still doesn’t make sense if I have to choose just one field for the x axis and one field for y… hmmm…
Indeed, and then rinse repeat for every metric resulting in 25 charts to tell a simple story.
@Bill.French Hmmm yes! Thanks for your brainstorming help, I’m not sure where I’ll take it from here haha, since I’m not too savvy with coding for the Vega-Lite stuff.
Understood - Vega is a fairly big techie pill to swallow but it certainly has the chops to create phenomenal data visuals.
Ideally, the folks at Airtable should make it possible to push arbitrary data into a Vega block, not just a selected table + rows.