
Summarize expenses in new table

  • October 7, 2022
  • 6 replies
  • 106 views

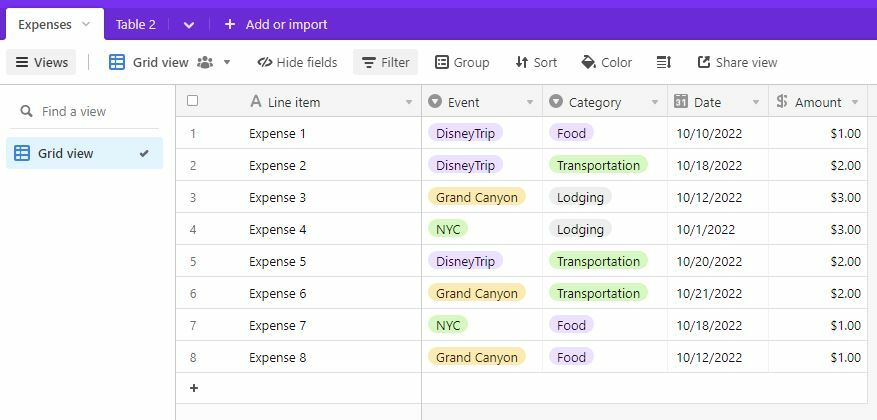
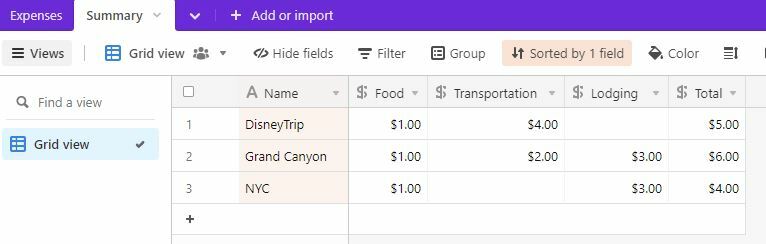
I have Expenses with fields EVENT and CATEGORY and AMOUNT. If I group and sort, I can see the sum of expenses for a particular EVENT by CATEGORY. But . . . I would like to summarize this on a separate table. I would like records which show the sums for my Events by Category.

I am a new user (very experienced in Excel) so please give detail! I understand how to use rollup, but can’t figure out how to create the records based on Event and Category from the Expenses table. Thank you.

This topic has been closed for replies.

6 replies

  • Participating Frequently
  • October 7, 2022

Hi, @Mary_Churchman ! Could you share a screenshot of how you have the table set up in the first table? Then we can better assist.


  • Author
  • New Participant
  • October 7, 2022

Hi, @Mary_Churchman ! Could you share a screenshot of how you have the table set up in the first table? Then we can better assist.


As I was working through this, I realized what I’m looking for is what I would do as a pivot table in Excel. I don’t know how to do pivot tables in Airtable yet, and frankly, for now, I would be happy to just have it display as a table. Here’s a scaled down version of my original table:

And here’s what I would like the summary table to look like (I have manually calculated the entries in this sample):

Thanks so much. . . . . PS . . . and . . . I just added the Pivot Table extension . . . so that accomplishes what I need, but I would still like to know how to do it in a regular table. Thank you.


  • Participating Frequently
  • October 7, 2022

As I was working through this, I realized what I’m looking for is what I would do as a pivot table in Excel. I don’t know how to do pivot tables in Airtable yet, and frankly, for now, I would be happy to just have it display as a table. Here’s a scaled down version of my original table:

And here’s what I would like the summary table to look like (I have manually calculated the entries in this sample):

Thanks so much. . . . . PS . . . and . . . I just added the Pivot Table extension . . . so that accomplishes what I need, but I would still like to know how to do it in a regular table. Thank you.


It seems like you came up with the best solution here. I’m not aware of a better one in Airtable.


  • Author
  • New Participant
  • October 9, 2022

It seems like you came up with the best solution here. I’m not aware of a better one in Airtable.


Thank you. This is actually just the beginning of a more complicated table I’d like to create, so the pivot table only gives me part of what I need . . . I’ll keep trying! I appreciate your time!


Forum|alt.badge.img+10
  • Known Participant
  • October 13, 2022

Hi @Mary_Churchman I was looking for a similar solution and came across your post.
Did you manage to create a new table out of a Pivot Table? Or just added the extension to the extension sidebar?


  • Author
  • New Participant
  • October 13, 2022

Hi @Mary_Churchman I was looking for a similar solution and came across your post.
Did you manage to create a new table out of a Pivot Table? Or just added the extension to the extension sidebar?


Actually my solution was right in front of me. As a new user I’m still figuring things out!

I just created different views in my original table. I simply filtered to a single event and then grouped by the expense category.

My table is a little more complicated than the example I gave. I have a “budget amount” field and an “actual amount” field, and I wanted to be able to see if I’m over or under budget. I created a field that calculates the difference in those two fields. It means nothing for each individual record (because each record is either a budget item or an expense item), but when I group and collapse all the records, the summary of budgeted amounts, actual amounts, and the difference shows up. Problem solved!