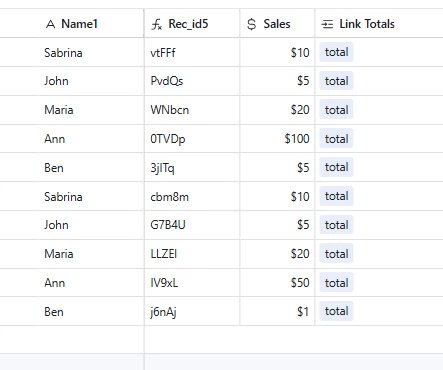
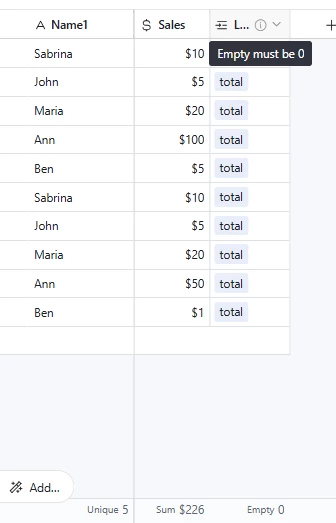
How can I get the average of the top/bottom 20%? For example, I have this table:
Name | Sales
Sabrina | $10
John | $5
Maria | $20
Ann | $100
Ben | $5
Sabrina | $10
John | $5
Maria | $20
Ann | $50
Ben | $1
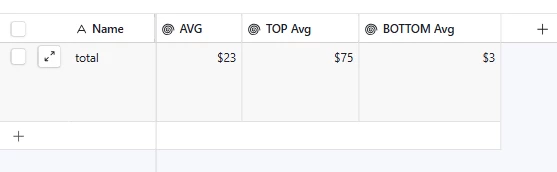
I want to see:
Top 20% (average sales from top 20% sales): $75
Average: $23
Bottom 20% (average sales from lowest 20% sales): $3
Thanks!
Best answer by Alexey_Gusev
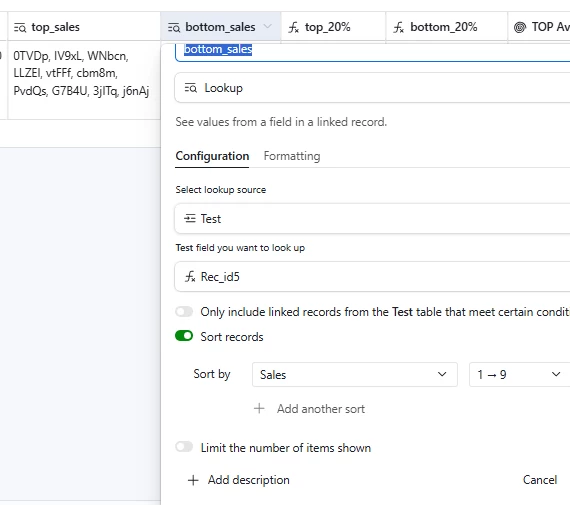
Hi, Usually different kind of totals in Airtable aggregated with other table, with only one record, linked to all records in source table. With all records linked, you can get Lookups, Rollups and Count. These fields are computed and based on links in linked field. They have the built-in filter and Sorting, and you can, for example, get highest 3 or lowest 3. But, when you have dynamic number, it’s a bit more complicated. Maybe easier way exists, but It’s not so complicated as it might look like. At least, you need formulas only, no scripts. The only thing where your might need automation - you have to ensure every record in table will be linked to ‘Totals’
It’s quite easy when you did that many times, but hard at first time.
I did that with Unique ID for each record RIGHT(RECORD_ID(),5) For more records, use bigger number to avoid accidental matches. You can take whole RECORD_ID, but it depends on how much records you have.
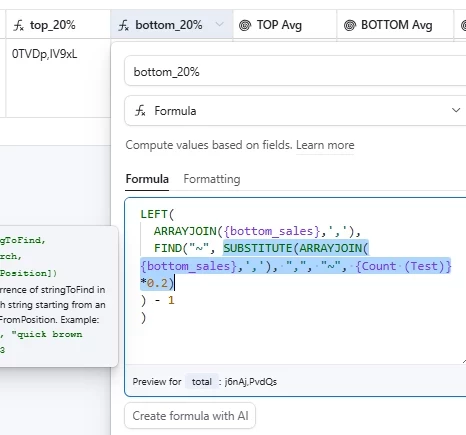
(then in ‘Totals’ table) - Take list of IDs, sorted by Sales and cut the part before Xth comma . X is Count of all records * 20% (here and after, bottom is almost same as top, just another sorting direction)
Important thing using Airtable formulas - Lookups are not strings, they are ARRAY of strings. so, to use some functions on them, you should turn ARRAY to a single string. That’s why I use ARRAYJOIN(Field, ‘ , ‘) instead of just Field. Example LEFT( {YourField}, FIND("~", SUBSTITUTE({YourField}, "X", "~", 7)) - 1) is a usual way to ‘cut part till the 7th X in string’)
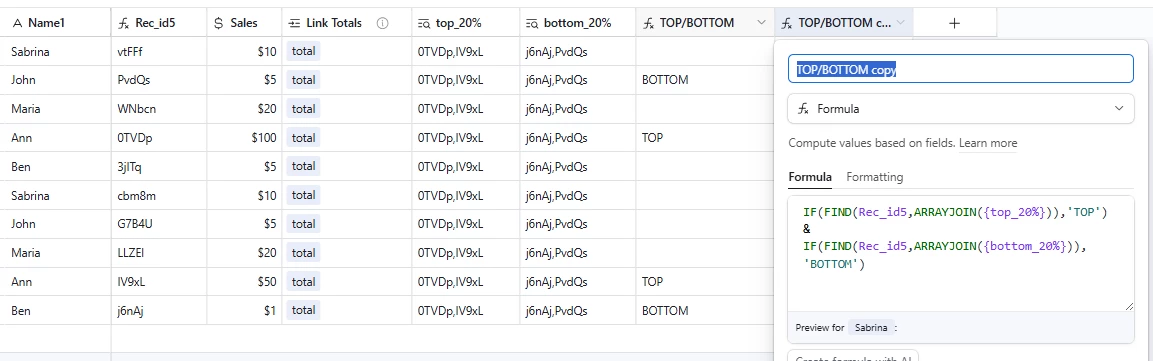
- then this list of 20% returned back to source table. formula finds ID in list and determine whether records is in TOP or BOTTOM
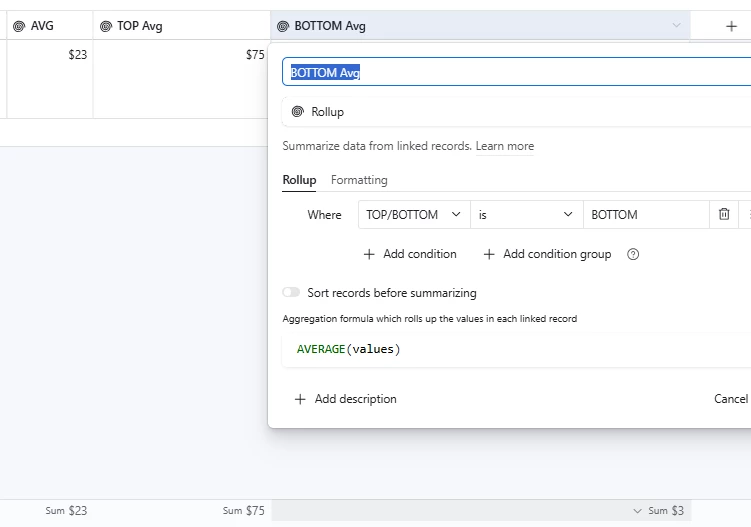
- and then ROLLUP counts AVERAGE of records with ‘TOP’ , ‘BOTTOM” and all
After all, you can hide all these computed fields. But you might want to leave Linked field to control that all new records will be linked.
I hope you’re doing well! This is definitely an interesting challenge, and I’d love to see what other folks in the community think as well. Here’s a solution I think could work nicely for you, it’s a bit of a process, but it should be reliable and scalable.
First, let’s set up a “Stats” table (or a helper table) with just one record that all your sales records will link to. You can do this with an automation, either by extending any existing automation that adds new sales or by creating a new one. This will ensure every new sale is linked to that single Stats record.
Next, we need to rank your sales from highest to lowest. Since Airtable doesn’t do dynamic ranking out of the box, the easiest and most straightforward method is to use a script automation. This script will re-rank all your sales whenever a new record is added, ensuring your ranking is always up-to-date.
Once your sales are ranked, you’ll calculate the total number of sales (count field on your stats table) and figure out what 20% of that total is. For example, if you have 10 sales, 20% would be 2. You can store this 20% count on your Stats table and then use a lookup field to bring that number back into your Sales table.
With that 20% count in place, you’ll add a formula field in your Sales table that flags the top 20% of sales. The formula will compare each record’s rank to the 20% threshold. If the rank is less than or equal to that number, it’ll be tagged as “Top 20%.” You can do the same logic in reverse for the bottom 20%, so you have both ends highlighted.
Finally, back on your Stats table, you can create a rollup field to calculate the average of the top 20% of sales and another rollup to calculate the average of the bottom 20%. Just set the rollups to only include records that have the “Top 20%” or “Bottom 20%” tag.
It’s a bit of a dance between lookups, rollups, and a script for ranking, but it should give you a reliable way to always identify and average your top and bottom sales percentages. Let me know if you need any help with the script or if you have any other questions!
Hi, Usually different kind of totals in Airtable aggregated with other table, with only one record, linked to all records in source table. With all records linked, you can get Lookups, Rollups and Count. These fields are computed and based on links in linked field. They have the built-in filter and Sorting, and you can, for example, get highest 3 or lowest 3. But, when you have dynamic number, it’s a bit more complicated. Maybe easier way exists, but It’s not so complicated as it might look like. At least, you need formulas only, no scripts. The only thing where your might need automation - you have to ensure every record in table will be linked to ‘Totals’
It’s quite easy when you did that many times, but hard at first time.
I did that with Unique ID for each record RIGHT(RECORD_ID(),5) For more records, use bigger number to avoid accidental matches. You can take whole RECORD_ID, but it depends on how much records you have.
(then in ‘Totals’ table) - Take list of IDs, sorted by Sales and cut the part before Xth comma . X is Count of all records * 20% (here and after, bottom is almost same as top, just another sorting direction)
Important thing using Airtable formulas - Lookups are not strings, they are ARRAY of strings. so, to use some functions on them, you should turn ARRAY to a single string. That’s why I use ARRAYJOIN(Field, ‘ , ‘) instead of just Field. Example LEFT( {YourField}, FIND("~", SUBSTITUTE({YourField}, "X", "~", 7)) - 1) is a usual way to ‘cut part till the 7th X in string’)
- then this list of 20% returned back to source table. formula finds ID in list and determine whether records is in TOP or BOTTOM
- and then ROLLUP counts AVERAGE of records with ‘TOP’ , ‘BOTTOM” and all
After all, you can hide all these computed fields. But you might want to leave Linked field to control that all new records will be linked.
Hi, please try to start with the selected part only. Pay attention to field names, Also, it would be easier to help if you provide a screenshot with your formula or tell more details. Formula cannot be saved? displaying errors? or saved OK but ouptut is nothing (or ‘ERROR#’) ?
@Alexey_Gusev I've got the selected part of the formula to work - I guess. It just gave me the same thing I have in the sorted sales column. Now what do I do to get the top or bottom 20% of sales? Sorry I am taking so much of your time.
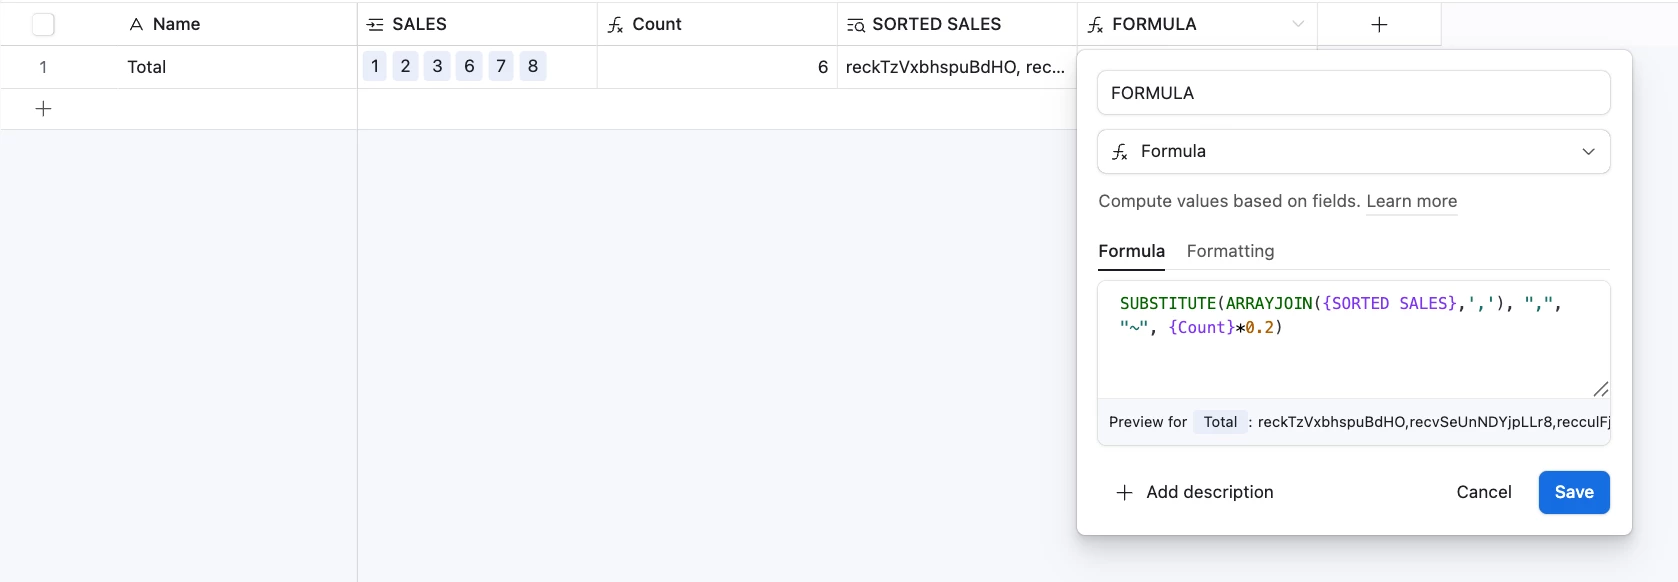
No problem, especially since it's my mistake. I didn't check other values besides 10, it turns out the SUBSTITUTION doesn't work when the fourth parameter is fractional, usually in such cases the formula converts it to an integer (i mean other formula functions). So, let's do it ourselves - you need to wrap the {Count}*0.2 into INT ( ), so it will be
INT ({Count}*0.2)
first comma will change to “~ “ in this partial formula, and full formula must work as planned.