I've been successful using Airtable data with quickchart.io to create charts that can be viewed in airtable or placed in Documint templates.
What I'm trying to do now is "dynamically" code the chart inputs vice "hard coding"
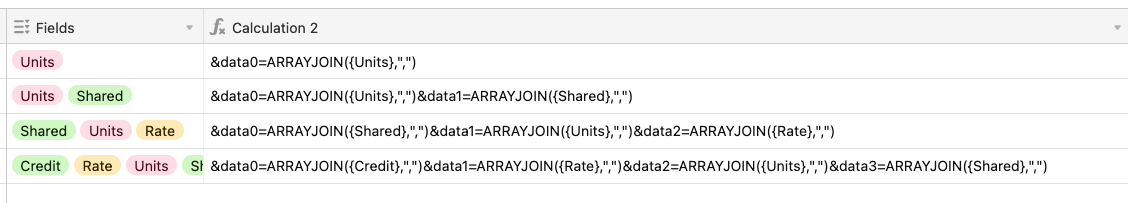
Specifically: I would like to select the fields to plot using a multi-select field and have that dynamically encode the chartURL.
Example: FieldsToPlot includes 4 items (Units, Rate, Shared, Credit)- and from this I need to dynamically create this code:
"&data1=" & ARRAYJOIN({Units}, ",") & "&data2=" & ARRAYJOIN({Rate}, ",") & "&data3=" & ARRAYJOIN({Shared}, ",") & "&data4=" & ARRAYJOIN({Credit}, ",")
I can use substitute() to alter the data from FieldsToPlot- but I'm stuck on incrementing the number since it won't always be 4 items. I've thought of using a count function to determine how many items, but I'm not sure how to increment the number in a formula without using a loop..
Anyone have any experience doing something like this?