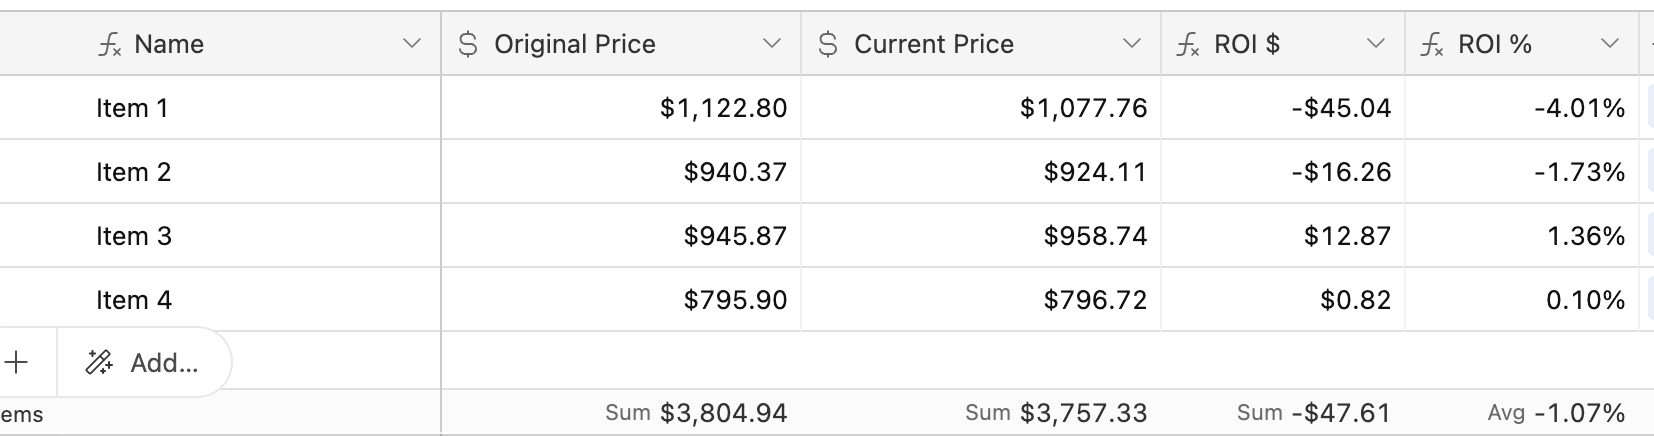
I can't wrap my head around this... For demo purposes, I have created a pretty simple base that looks like so, and this all looks good
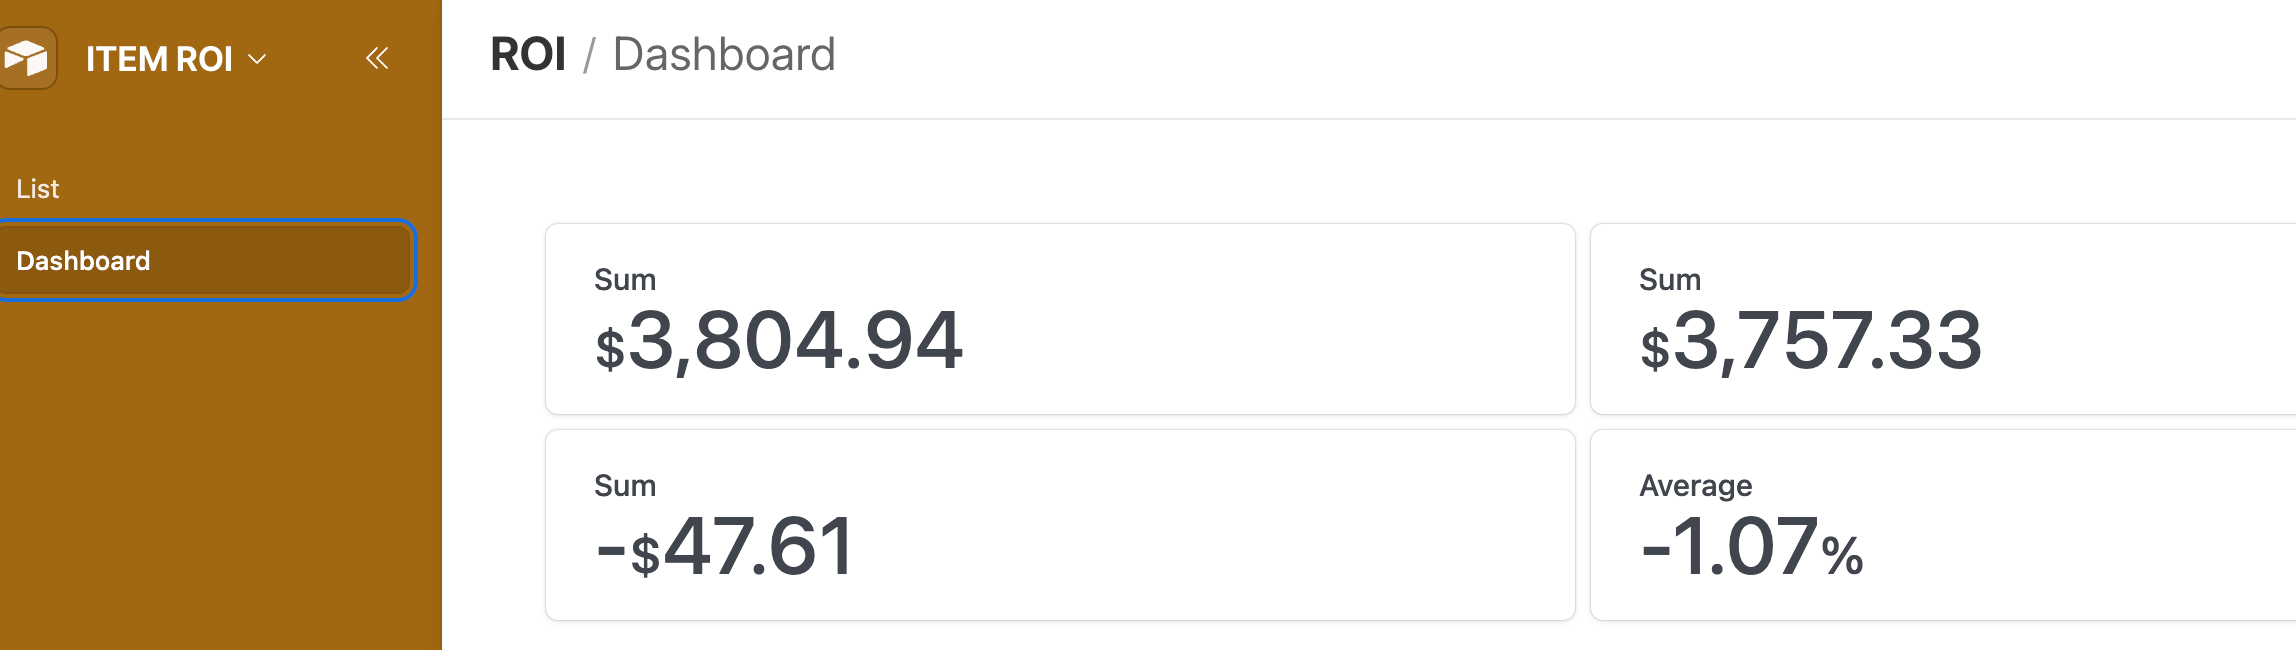
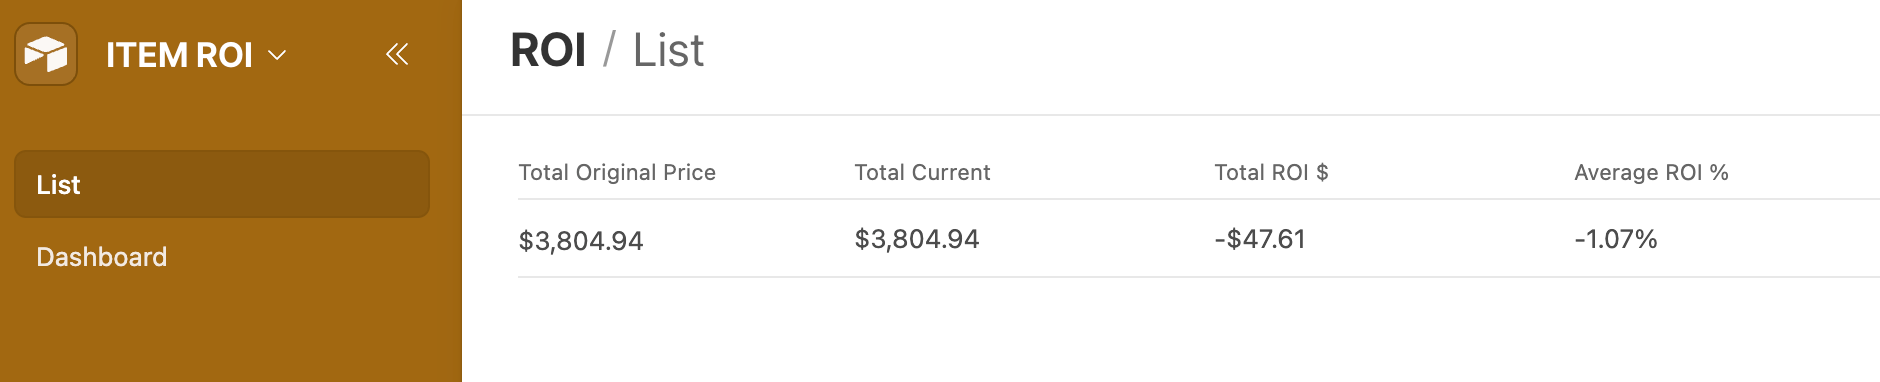
Then I created a simple interface; the only problem is the item highlighted, which is incorrect.
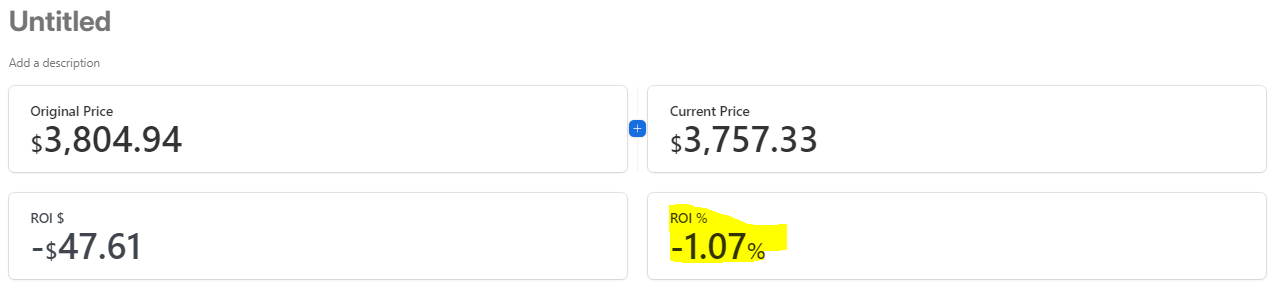
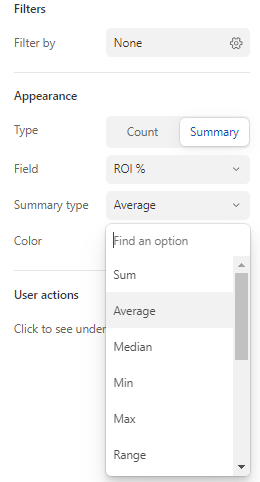
I have tried all the options, and nothing is giving me the correct %.
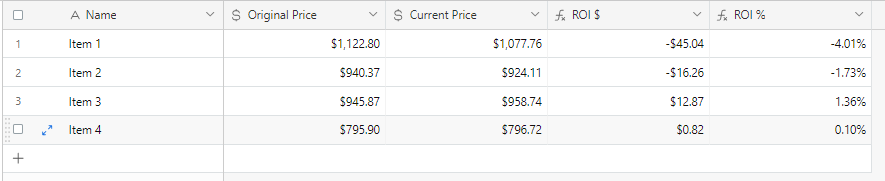
If I plot the same data in Excel, this is what I see:
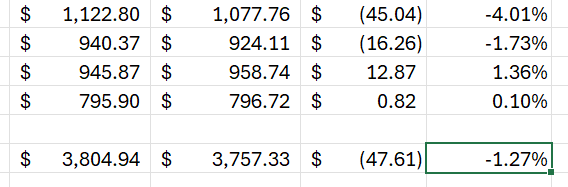
Any idea how do I get the right ROI % (I need the result from the same table)?