
Hello,

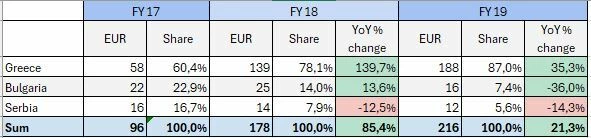
I'm wondering if it's possible to get a pivot view in Airtable similar to those in Excel and Google Sheets that would show multiple values ​​at once, e.g., the sum of the values ​​along with the share of the total and the percentage change year-over-year. Like in the example below.

Many thanks for help

Hm, yeah I don’t see an option to group the columns sadly so we might be out of luck here


Hi ​@Andrzej,

Those sorts of pivot tables aren’t possible in Airtable.

I demonstrate how to create pivot tables on this Airtable podcast episode, so you can see the extent of how far you can go with pivot tables in Airtable.

If you want to create pivot tables like the one in your screenshot, you would need to do that in Microsoft Excel or Google Sheets.

You can automate the process of sending your data from Airtable to Microsoft Excel or Google Sheets by using Make’s Microsoft Excel integrations or Make’s Google Sheets integrations, in conjunction with Make’s Airtable integrations.

If you’ve never used Make before, I’ve assembled a bunch of Make training resources in this thread. For example, here is one of the ways that you could instantly trigger a Make automation from Airtable.

I also give live demonstrations of how to use Make in many of my Airtable podcast appearances. For example, in this video, I show how to work with Airtable arrays in Make.

Hope this helps!

If you’d like to hire the best Airtable consultant to help you with anything Airtable-related, please feel free to contact me through my website: Airtable consultant — ScottWorld