I have started a blank canvas instead of using a template to show various data. Is there a way to use a pivot table within a blank canvas?
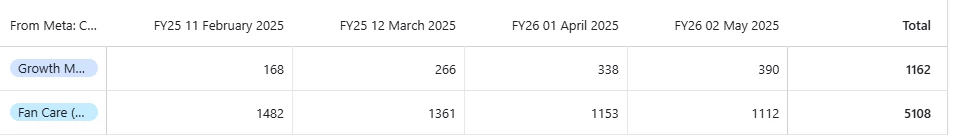
I want to show points given by each team as the column and each row would be the team then across the top would be each month and then within each would be the number of points given.
I would then want to replicate this with the amount of submissions example is below using the template