

Hi there... We are trying to use Airtable to forecast workload capacity vs. demand.
Each project in our forecast has a number of tasks. Each task is assigned a "skill" (the skill required to complete that task), a person-week effort to complete it, and start/end dates. (there's other metadata as well - owners of the tasks, the project each is mapped to, etc)
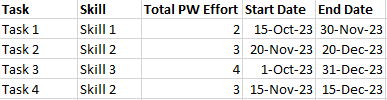
We want to know the total demand required for each skill for each month, and be able to tweak these numbers to match our capacity (which is the same every month). I'm starting with a regular list of scheduled tasks like this:
I've been able to parse the start/end dates and determine the amount of work required for specific months, to get something like this:
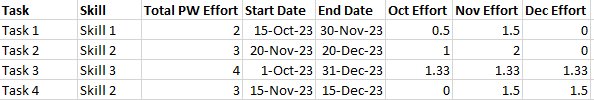
However, now my monthly effort data is in columns, which causes all kinds of problems - I can't graph it across all months or pivot on it. Plus, I need to roll this up to the Project level, but only for certain sets of projects (e.g. all projects of a specific type, etc). However, I can't create a dynamic rollup that changes depending on what I need. So, I'm stuck with making a full set of ~15 rollup columns for each need - which is not practical.
I think what I need is the same data structured like this:
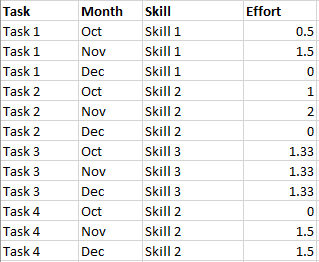
But I'm not sure how to get there. Plus even if I could run a script that'd transform my data to look like this, how can I keep this new database updated in real-time so every time a date is changed, this resulting database would reflect those changes?
Any general ideas about how to approach this, or other completely different approaches that might work better?
