May 01, 2020 11:12 PM
I have a base where I have separated expenses into a few different tables. I did that to make it a little clearer for me as it became so cluttered. But now it’s hard to add up the prices and compare. How do I create a dashboard that truly just takes the sum of one column from each table that I have?
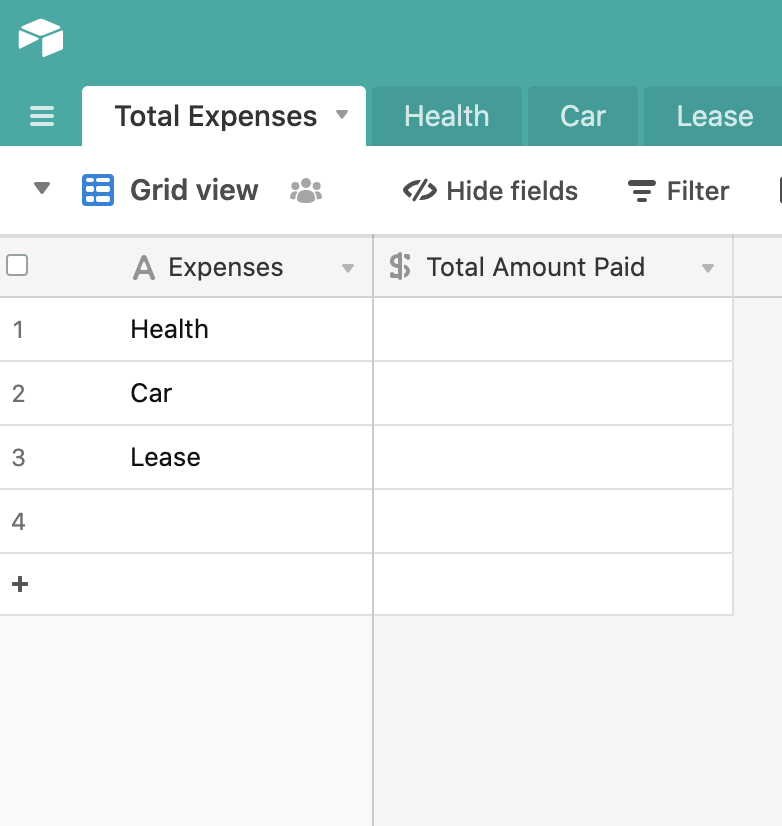
For ex: I have a table for health insurance, car matinence & lease payments. How would I create a dashboard like summary where I can display the total sum of each of these?
So it would look like:
I tried linking, rollup and lookup but just can’t figure it out. I have used airspace for a long time, but only for simple data entry. I do not have pro.
Solved! Go to Solution.
May 02, 2020 06:51 PM
Unfortunately, there is no automated way in Airtable to create a “dashboard” table like what you created. That’s because there is no way to automatically link records in Airtable.
The only way that you can link records in Airtable is by MANUALLY linking them. (Unless you’re converting a text field to a linked field, in which case Airtable does a one-time-only linking for you.)
Your best bet for accomplishing this would be to put ALL of your expenses into ONE table called “Expenses”, as @Mohamed_Swellam said. Then, you would add a field called “Category”, so you could tag each one of your expenses with their own category.
(Alternatively, your categories could live within their own table called “Category”, and you could link each expense to a category. But if you’re just starting out with Airtable, it would probably be easier to just keep everything together in one table for now.)
Then, once you’ve got all of your expenses in one table with their Categories attached to them, then you could group your Expenses table by Category — and Airtable even has the built-in ability to automatically summarize (total) grouped categories for you. The choice for that will appear right in the Grouped header itself.
Also, once all of your expenses are together in one table, that gives you the opportunity to do other cool things too, like filtering your records, or applying a pivot table block to them so you can summarize your expenses in a variety of different ways.
May 02, 2020 01:22 AM
Hi @Catherine,
You were on the right track with the linking fields and rollups. You should make a Field in each table that linked to this table.
The fact that you have different tables for different expenses is not the best setup though. Having your expenses in one table and labeling them as you need is much better.
BR,
Mo
May 02, 2020 06:01 PM
I totally understand. That is how I used to have it but it actually helps me so much more by having the expenses in different tables.
Okay I make a field in each table that is linked to the summary table. But then what, I am so confused? Now I just have a blank column… I just want to take the sum of the expense column and then output it in the summary.
May 02, 2020 06:51 PM
Unfortunately, there is no automated way in Airtable to create a “dashboard” table like what you created. That’s because there is no way to automatically link records in Airtable.
The only way that you can link records in Airtable is by MANUALLY linking them. (Unless you’re converting a text field to a linked field, in which case Airtable does a one-time-only linking for you.)
Your best bet for accomplishing this would be to put ALL of your expenses into ONE table called “Expenses”, as @Mohamed_Swellam said. Then, you would add a field called “Category”, so you could tag each one of your expenses with their own category.
(Alternatively, your categories could live within their own table called “Category”, and you could link each expense to a category. But if you’re just starting out with Airtable, it would probably be easier to just keep everything together in one table for now.)
Then, once you’ve got all of your expenses in one table with their Categories attached to them, then you could group your Expenses table by Category — and Airtable even has the built-in ability to automatically summarize (total) grouped categories for you. The choice for that will appear right in the Grouped header itself.
Also, once all of your expenses are together in one table, that gives you the opportunity to do other cool things too, like filtering your records, or applying a pivot table block to them so you can summarize your expenses in a variety of different ways.
Aug 04, 2024 08:18 AM
I have 3 tables with same data fields, you can say 1 table for every month with same data fields. I want same table for automatic total of all months tables. How to do this ? pls guide.