Oct 07, 2022 09:29 AM
I have Expenses with fields EVENT and CATEGORY and AMOUNT. If I group and sort, I can see the sum of expenses for a particular EVENT by CATEGORY. But . . . I would like to summarize this on a separate table. I would like records which show the sums for my Events by Category.
I am a new user (very experienced in Excel) so please give detail! I understand how to use rollup, but can’t figure out how to create the records based on Event and Category from the Expenses table. Thank you.
Oct 07, 2022 10:35 AM
Hi, @Mary_Churchman ! Could you share a screenshot of how you have the table set up in the first table? Then we can better assist.
Oct 07, 2022 11:50 AM
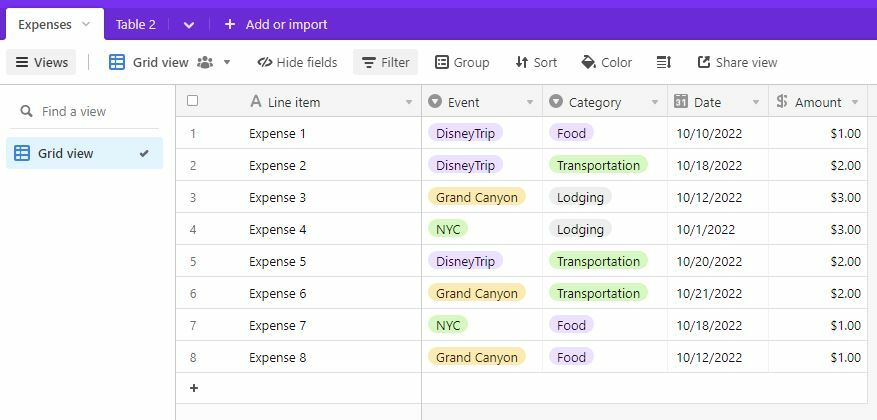
As I was working through this, I realized what I’m looking for is what I would do as a pivot table in Excel. I don’t know how to do pivot tables in Airtable yet, and frankly, for now, I would be happy to just have it display as a table. Here’s a scaled down version of my original table:
And here’s what I would like the summary table to look like (I have manually calculated the entries in this sample):
Thanks so much. . . . . PS . . . and . . . I just added the Pivot Table extension . . . so that accomplishes what I need, but I would still like to know how to do it in a regular table. Thank you.
Oct 07, 2022 04:00 PM
It seems like you came up with the best solution here. I’m not aware of a better one in Airtable.
Oct 08, 2022 06:41 PM
Thank you. This is actually just the beginning of a more complicated table I’d like to create, so the pivot table only gives me part of what I need . . . I’ll keep trying! I appreciate your time!
Oct 13, 2022 02:53 AM
Hi @Mary_Churchman I was looking for a similar solution and came across your post.
Did you manage to create a new table out of a Pivot Table? Or just added the extension to the extension sidebar?
Oct 13, 2022 05:16 AM
Actually my solution was right in front of me. As a new user I’m still figuring things out!
I just created different views in my original table. I simply filtered to a single event and then grouped by the expense category.
My table is a little more complicated than the example I gave. I have a “budget amount” field and an “actual amount” field, and I wanted to be able to see if I’m over or under budget. I created a field that calculates the difference in those two fields. It means nothing for each individual record (because each record is either a budget item or an expense item), but when I group and collapse all the records, the summary of budgeted amounts, actual amounts, and the difference shows up. Problem solved!