Feb 21, 2022 07:34 PM
Hey everyone! Fairly new to airtable and still learning about automations and formulas. We are creating a fairly complex app for medicinal products.
In our base we have a products table and an indications table. An example of an indication would be “Pain” - This is linked to a stacker front end. What I’m trying to achieve is to be able to count how many times a single indication has been given to a product. For example: When someone is adding an indication such as “Pain” to a product they can see “5 others added this indication”. and once added it’s then updated so that it appears as 6, 7 so on.
I have been able to automate a count which listens for when an indication is added and ticks up however this doesn’t work because each time any indication is added or removed it continues to tick up. Trying to figure out how to make it dynamic so that it can update and change for any product.
Any help would be greatly appreciated
Feb 21, 2022 09:55 PM
Hello @Kai_Craig! Welcome in!
I’m quite curious about your use case, especially because I’m not familiar with Stacker.
I have a few things I wanted to get a bit more context on if you don’t mind!
How are users interacting with your records/data?
I’m someone that thinks of things in start-to-finish stories.
What’s the ‘story’ of how a user begins interacting with your system/data, how does it progress, and how does it end in a perfect world?
Are the “Indication” records set? Or can users create new records in the indications table? What about the Products table?
Feb 22, 2022 03:37 PM
Hi Ben,
Thanks for getting back to me. I’ll elaborate.
So what we’re building is a system for patients, doctors, clinicians, pharmacists and suppliers to view, manage and update medicinal cannabis products.
Suppliers are able to add/update/remove their products. This the main functionality of the app at the moment. The idea is that clinicians and pharmacists can then view these products and based off the information they can recommend or prescribe them.
This is where indications come in - There are two types:
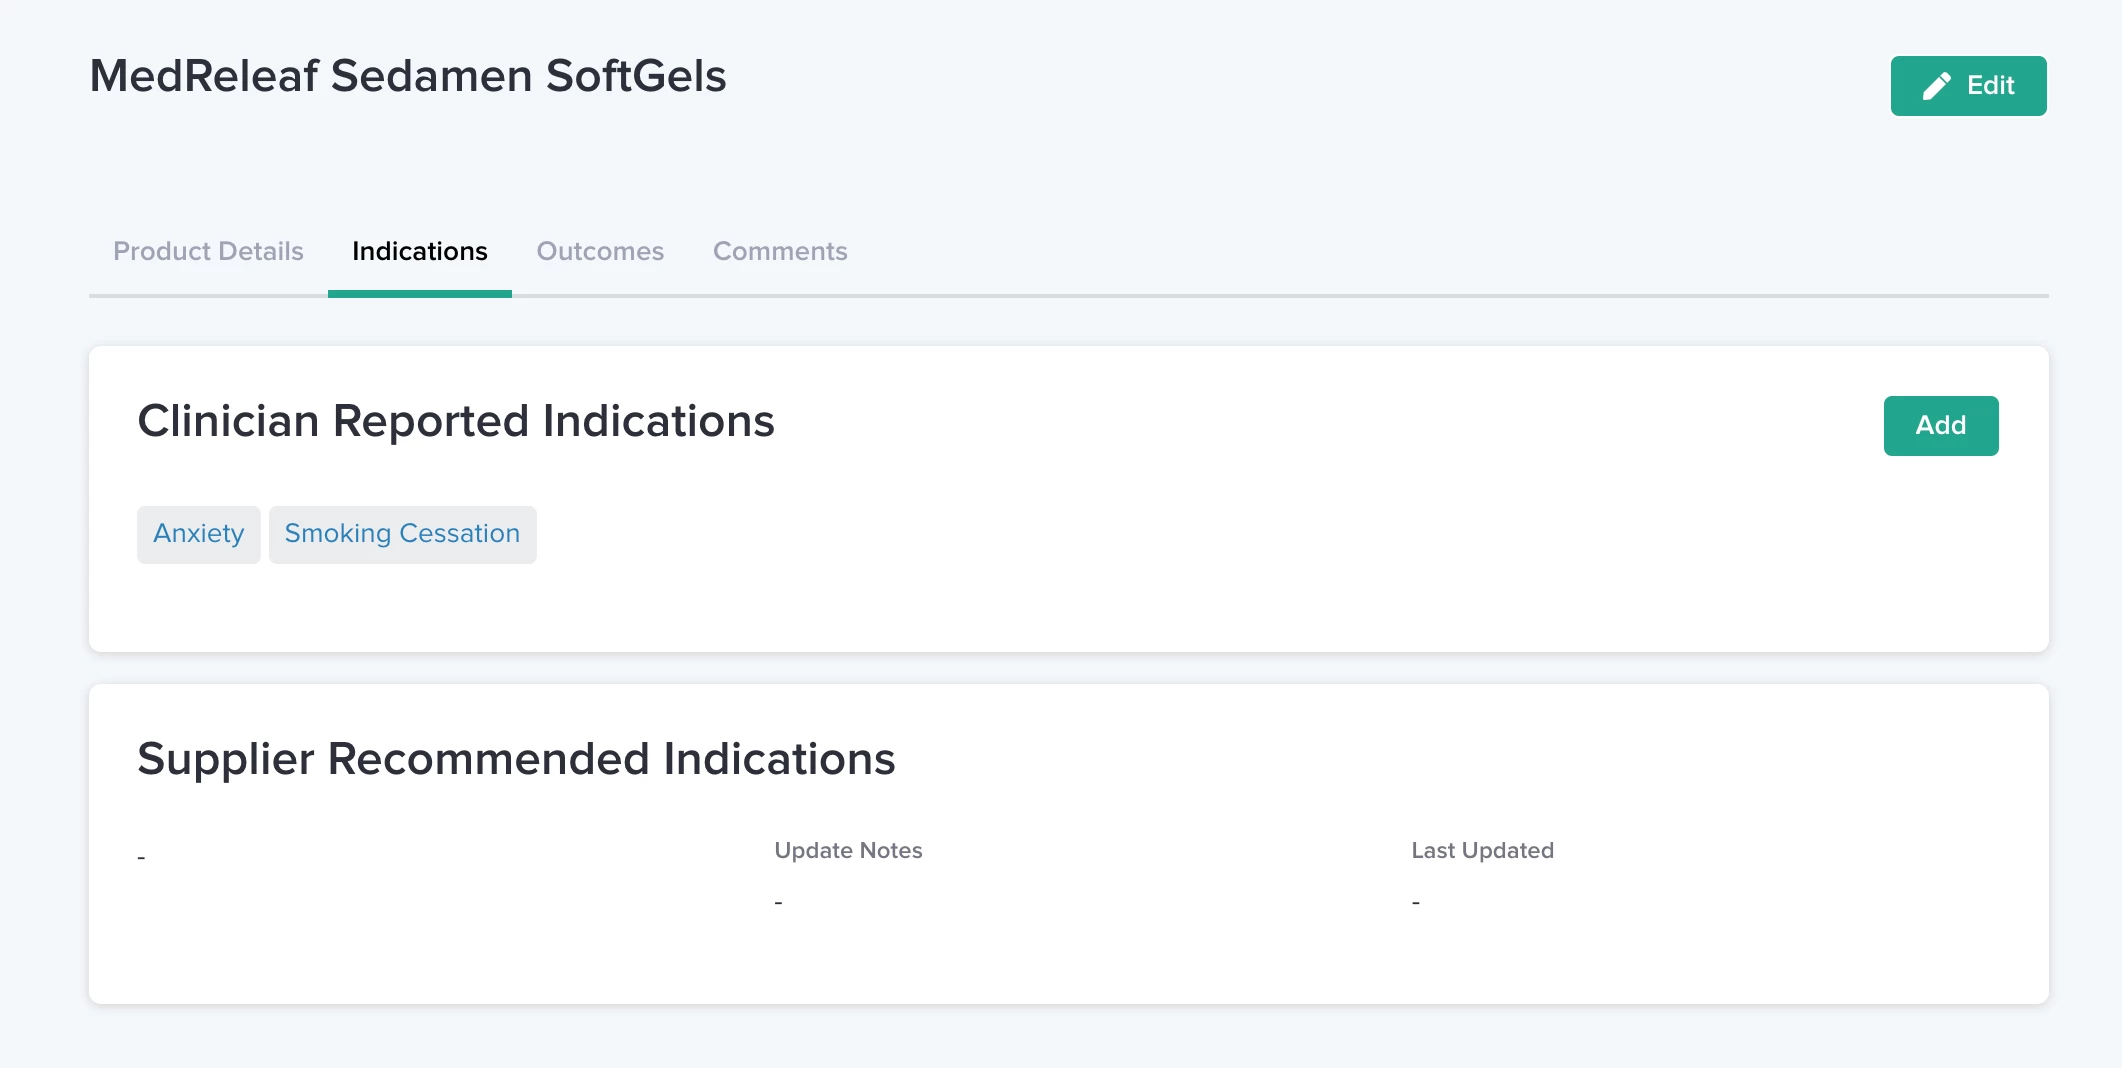
Supplier Recommended Indications
These are entered by the supplier from their findings
Clinician Reported Indications (ClinROs)
These are entered by clinicians based on their findings.
Then eventually we will have Patient Reported Indications
Patients will then be able to record their own personal experiences
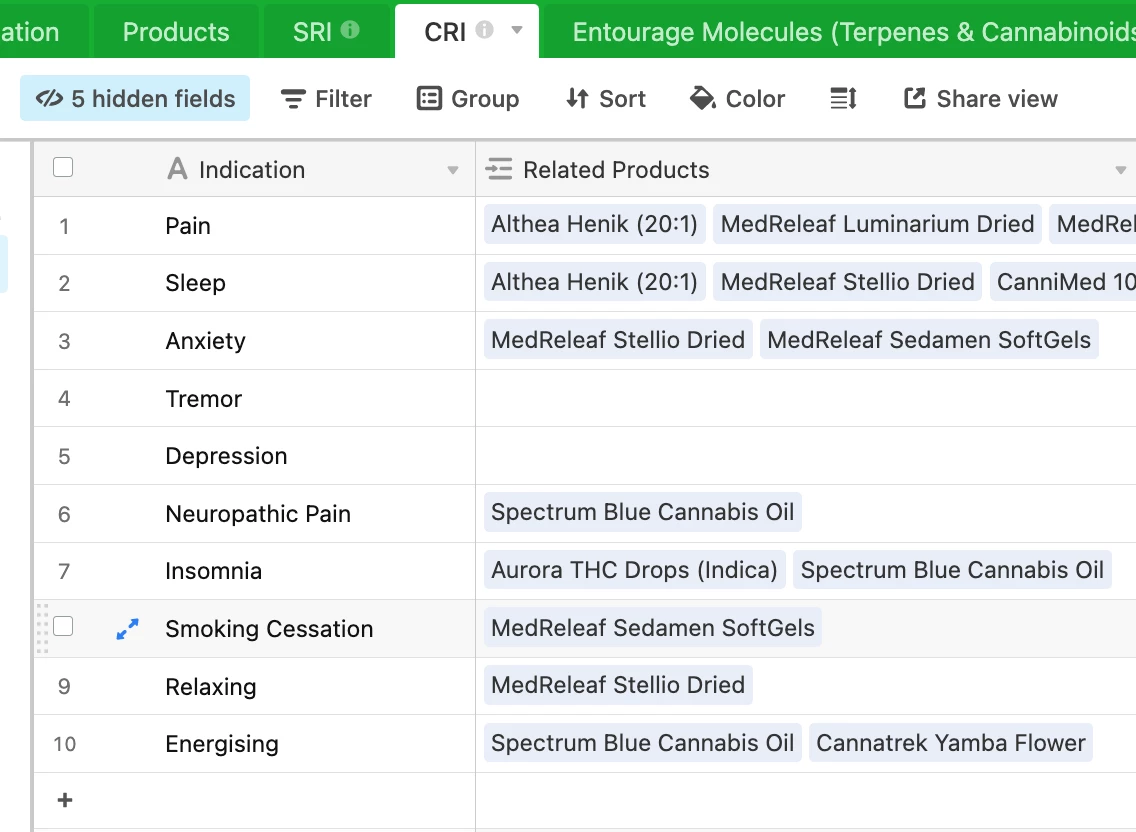
Each of these indications have their own tables and are linked to the products table.
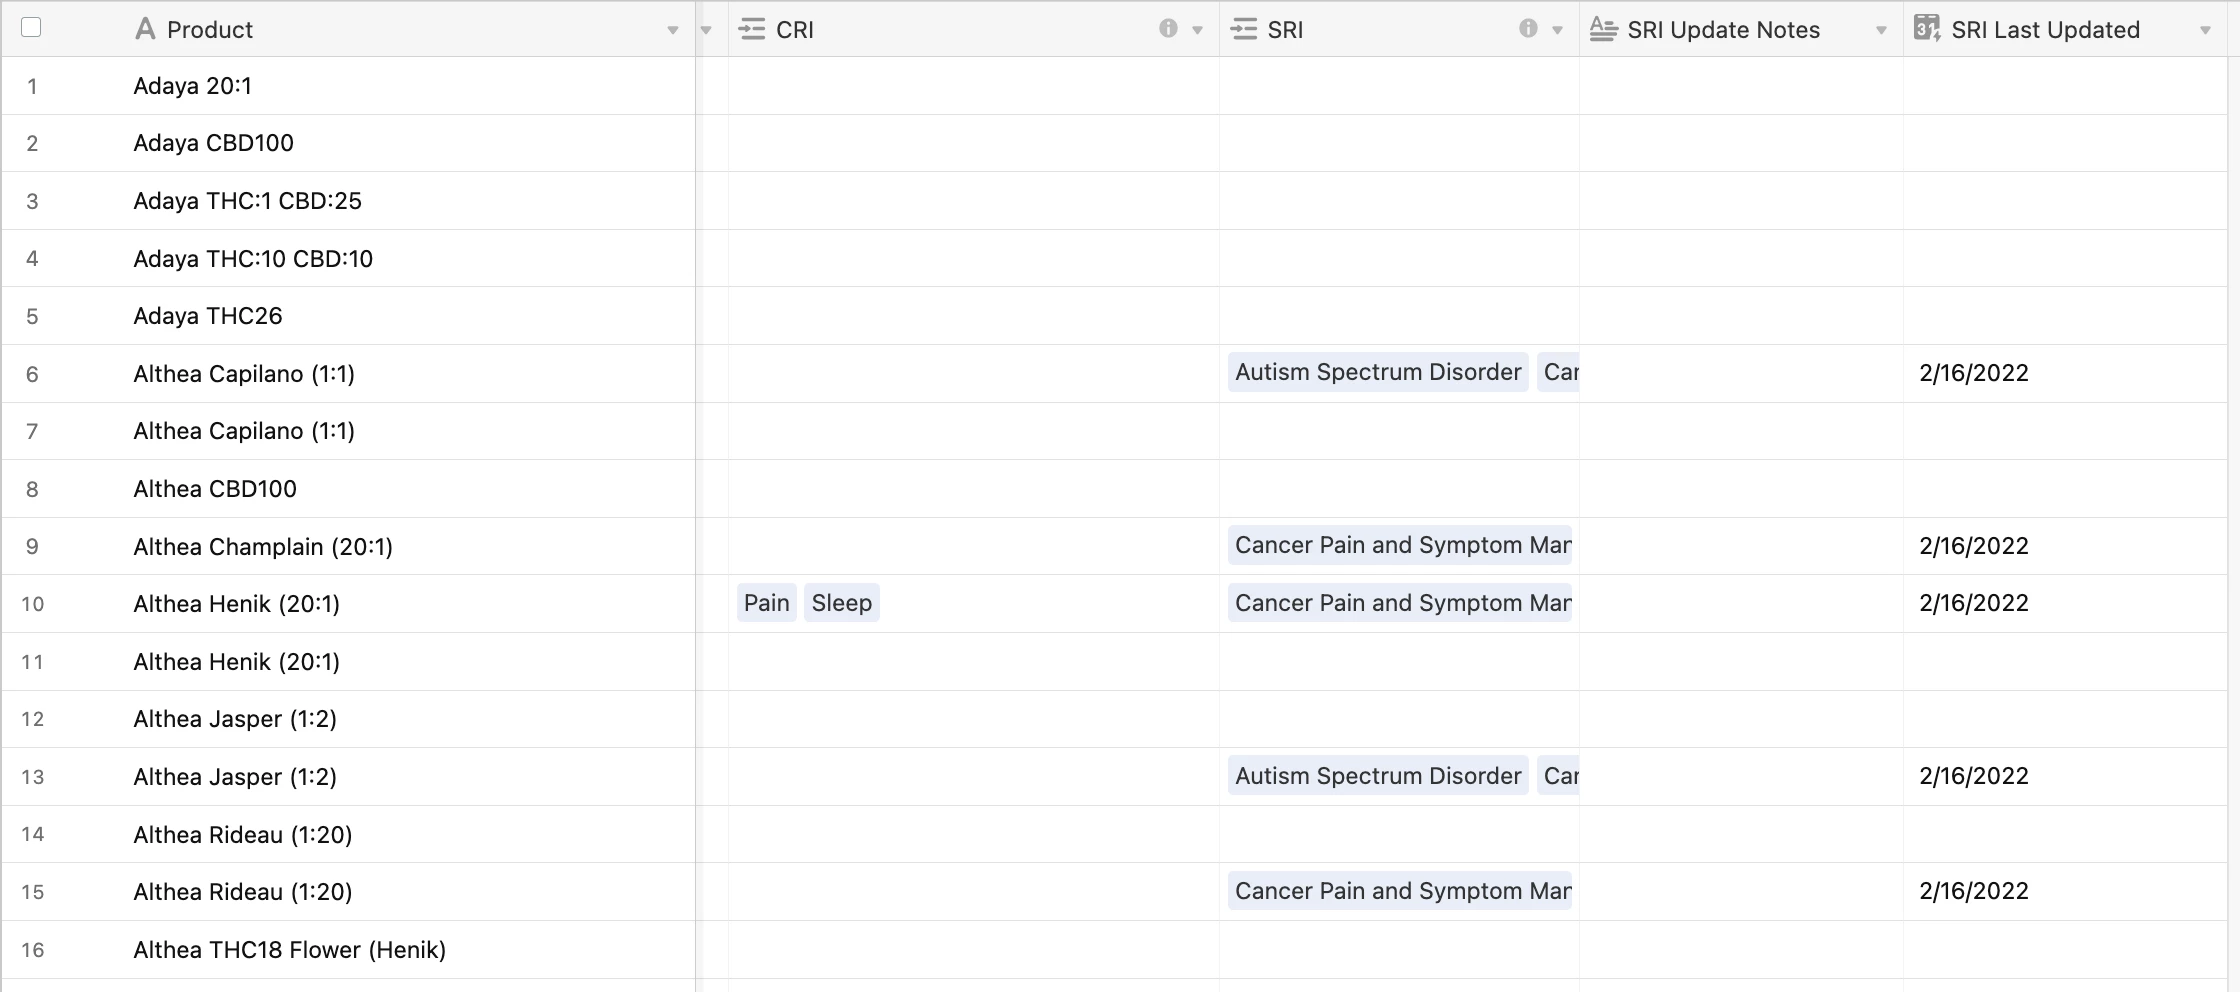
We currently have all the links setup and everything works and displays how it should. However we are trying to figure out a way to record the amount of times a particular indication has been given to a single product. When someone views a product they can see the indications given eg.
How it looks:
Product
Clinician Reported Indications
Pain, Headache, Ect
How we’d like it to look:
Product
Clinician Reported Indications
Pain(24), Headache(5), Ect
I’ve thought of several ways to try and achieve this but I’m not very familiar with automations and formulas so I haven’t been able to test. It’s easy to count the indications overall, but when you try and split it into counting a particular indication per product I can’t seem to figure it out. But there must be a way.
Any help is greatly appreciated, I hope this information provides you with some more insight into what we’re trying to achieve.
Feb 24, 2022 12:12 AM
For some reason, I’ve been very invested in this problem since I first started playing around with it.
Let me toss you a possible implementation.
Tell me what you think. We’ll refine it a bit based on your feedback.
Here’s the sandbox I’ve been doing all of this in. I’ll keep working in here in regards to your post/question, but feel free to make a copy and toy with it as well. All of the data is just based on your screenshots and the rest is just filler.
My first recommendation is that you tweak your base design a tiny bit.
Something that immediately caught my attention is the separate tables you have for CRIs, SRIs, and eventually PRIs.
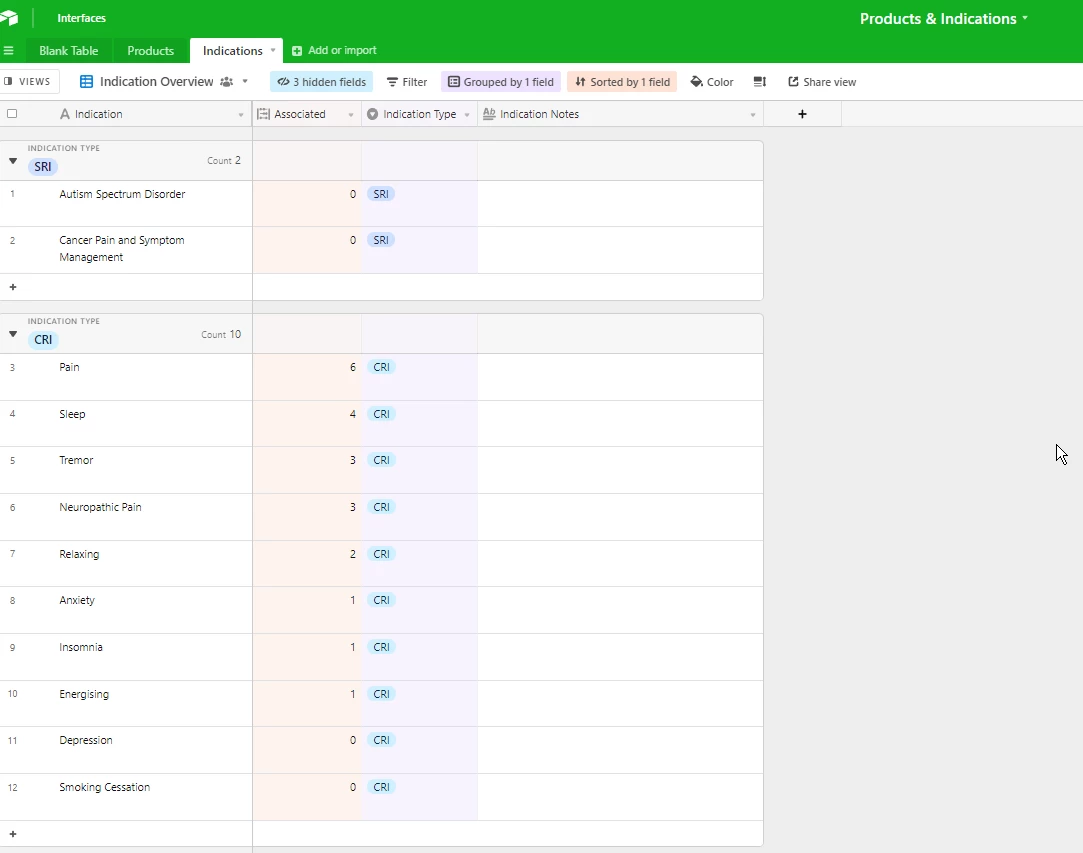
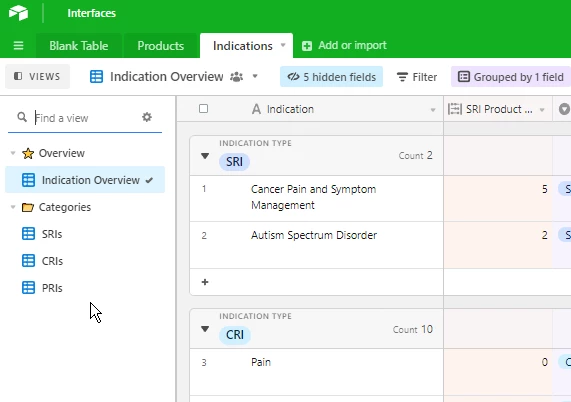
Now, since each record in all of those tables is a record of an individual indication, we can actually make a single table for all of our indications.
In my sandbox, I just created a single select field for the indications that designates them as being a CRI/SRI/etc.
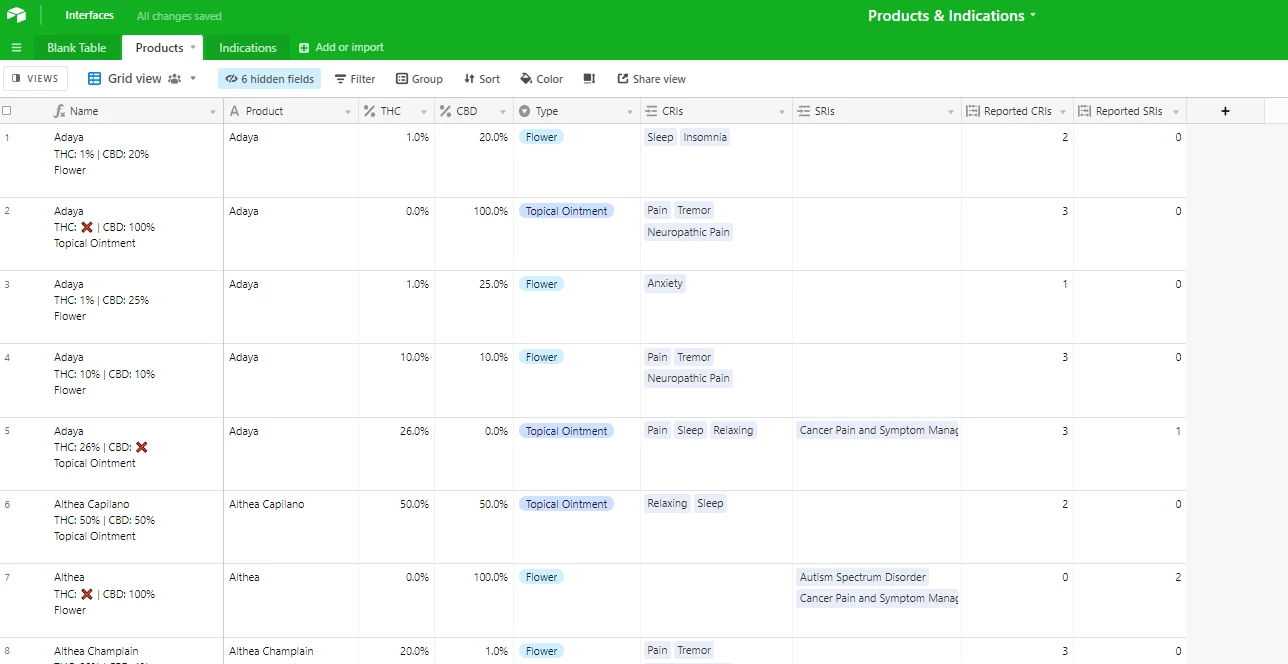
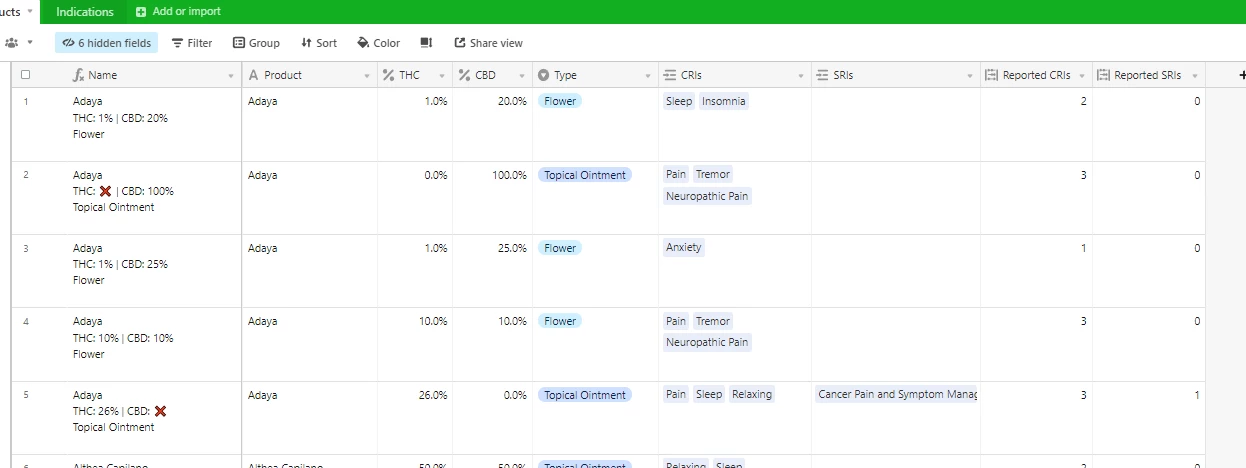
Now, in the Products table, I’ve tweaked the structure a bit.
Don’t focus on my toying around and formatting experimentation. I’ll outline some of them below, as well as the reasoning behind some of them (if you’re curious).
From what I understand all-in-all, you need a real-time count of the categories of SRIs and CRIs (eventually PRIs).
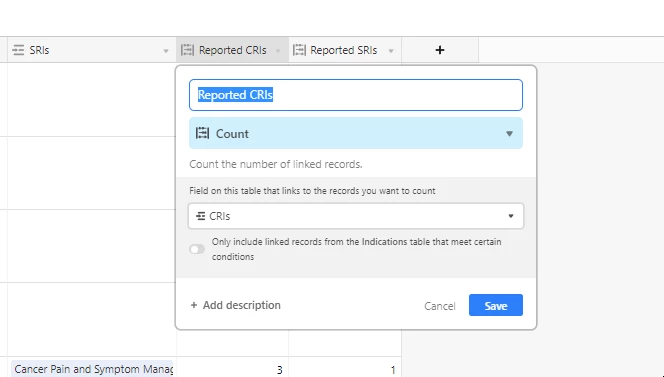
There are two separate count fields (and another hidden PRI field, since there’s no PRI data yet) that individually count the linked records of each record “type”.
When I created the Indications table, I created views for each category.
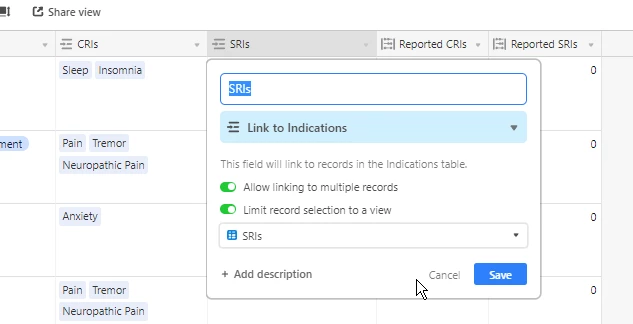
I then created linked record fields for each indication category and used that as the filter on the linked record field.
This allows you to separate the records that can be linked, whilst also maintaining a clean base data model by keeping all your indications in a single table.
From there, all I did was create count fields for each indication type and set the configuration as shown in the screenshot below.
That will then give you the up-to-date count of all the indications associated with a product.
It will also allow you to separate how many of each category there are.
Here’s the final product:
Okay, if you’re curious about my tweaks to the table layout, here’s a walkthrough of my decisions.
In the screenshots you shared, I noticed that you had a lot of products that had very similar names.
I probably totally misunderstood the overall implementation, but I’ve separated out dosage(?) data into two different percent fields. I noticed that you had some ratios, but I also saw the percentages, hence I left out the ratios for the sake of streamlining.
With those things separate, I used a formula to combine those fields to create a unique ‘tag’ for each record that highlights the differences in the products beyond just their names.
Here’s the formula if you’re curious.
It was just me messing around.
IF(
AND(
{Product}
),
{Product} & "\n" &
IF(
{THC},
"THC: " & ({THC} * 100) & "%",
"THC: ❌"
) & " | " &
IF(
{CBD},
"CBD: " & ({CBD} * 100) & "%",
"CBD: ❌"
) &
IF(
{Type},
"\n" & {Type}
),
"Missing Product Information"
)
I noticed you had a “flower” in one of the records, so I just went ahead and created a random product type field.
Again, no clue what your data looks like, so feel free to disregard it lol.
I’m trying to think of anything else, but I can’t think of any right now.
Again, take a look at the viewing link and lemme know if you’re curious for more, or if you have what you need.
Feb 24, 2022 03:44 PM
Hey Ben!
Thanks for such a detailed approach, I really appreciate the time you have taken to come up with this!
I strongly agree with the restructure, that works so much better for our database as I try to avoid having extra tables. I will definitely be implementing this into our database provided everything works! I also never knew you could go into that much detail with formulas to display products in that way! - I can see a bunch more possibilities with this moving forward.
This is a really great solution for counting the total amount of indications per product, however we’re trying to achieve counting one step further.
Clinicians are able to add the indications to the products, however we need to be able to count/see how many times a single indication is added to a product. For example, a clinician goes to add “Pain” to “Adaya”, but 3 other clinicians have already indicated this. The database should in-turn be able to show that “Pain” was indicated by 3 other clinicians. This could be shown like “Pain(3)”. The Clinician would then be able to add “Pain” again and the count will update to Pain(4).
The reasoning for this is so we can record not only a history over time of indications and how many times they were indicated but also for reporting and accuracy. Clinicians and pharmacists will be using the data to determine how accurate an indication is, so if we can show how many times a particular indication is given to a single product - EG. 10 other clinicians indicated Pain. Then they can safely assume that it helps with Pain and this will help them with prescribing the products.
Since a particular user will be indicating these…
Maybe when someone adds an indication we can link it to the user and count the total number of users who have indicated the indication eg. “Pain” to a particular product. However I’m not sure how we would achieve that? I keep coming back to your solution where it’s easy to count the total amount for an indication but not the times a single indication has been given to a product.
One limitation we have with stacker is that we connect through an API key so we can’t send per-user data that way as airtable recognises stackers updates as a single user. If we went down that route I image we would have to link the user to the table through a linked field.
I hope that makes sense?
And for the data that you’ve gathered through the screenshots, there are about 50 or so product variables so I won’t go into them but what you have gathered works fine and shouldn’t effect the solution.
Thanks again for taking the time, I’m keen to continue working on this with you and see if we can figure it out!
Mar 08, 2022 09:59 AM
Hey @Kai_Craig!
Noticed this thread again and was curious if you’ve built a solution.
This was such an interesting use case.
Mar 08, 2022 01:01 PM
Hey @Ben.Young,
Unfortunately we are still trying to figure it out! The solution you provided was great for counting the total indications however in my last post I dove a little deeper into why we needed to count how many times a single indication has been given to a product.