Save the date! Join us on October 16 for our Product Ops launch event. Register here.
Feb 06, 2023 04:45 AM
Hi there smart people!
I'm looking to show the percentage of improvement since the implementation of our new Figma redlining process from our team survey. Right now, 5/8 people say the process has either improved or greatly improved! Is it possible to show this in Airtable's Interface? Either as 5/8 or 63%? Participants will continue to add to this survey in the coming weeks. So, I need a create a formula that will update the Interface accordingly.
Please, let me know if anyone has an answer!
Solved! Go to Solution.
Feb 06, 2023 05:30 AM
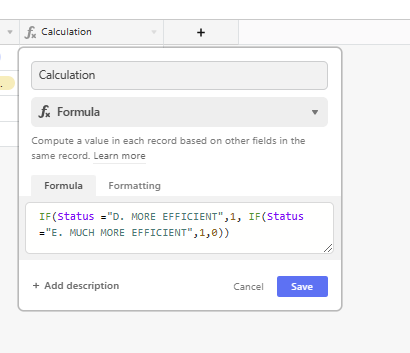
one way is to create a formula which creates a 1 if your condition (improved or greatly improved) is fulfilled and 0 if not.
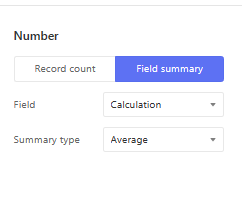
then create a number element which you set to this field and then make the summary type average
Feb 06, 2023 05:46 AM - edited Feb 06, 2023 05:50 AM
FORMULA
AND THEN NUMBER
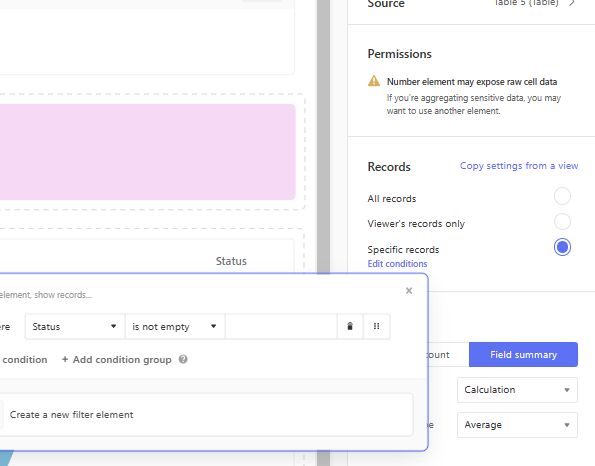
IF YOU HAVE BLANK RECORDS THEN YOU NEED TO FILTER THESE OUT AT THE NUMBER PHASE TO EXCLUDE ANY WHICH HAVE NOT GOT A RESPONSE TO THE QUESTION
Feb 06, 2023 05:30 AM
one way is to create a formula which creates a 1 if your condition (improved or greatly improved) is fulfilled and 0 if not.
then create a number element which you set to this field and then make the summary type average
Feb 06, 2023 05:33 AM
Thanks so much! Can you let me know what those formulas would be?
Feb 06, 2023 05:46 AM - edited Feb 06, 2023 05:50 AM
FORMULA
AND THEN NUMBER
IF YOU HAVE BLANK RECORDS THEN YOU NEED TO FILTER THESE OUT AT THE NUMBER PHASE TO EXCLUDE ANY WHICH HAVE NOT GOT A RESPONSE TO THE QUESTION
Feb 06, 2023 08:25 AM
Thank you! This is magic!!