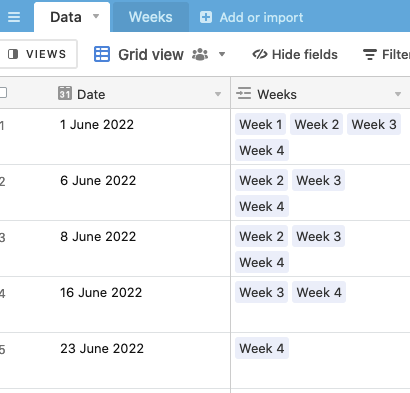
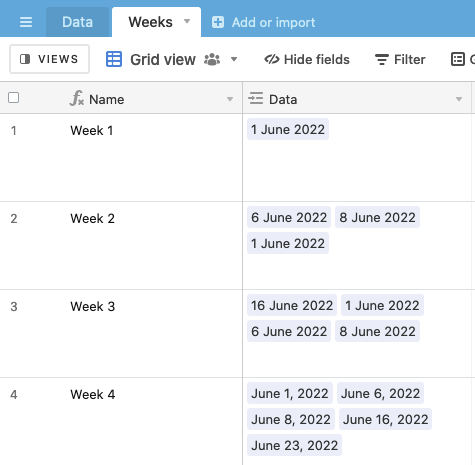
I’m trying to create a line graph that shows the growth of the sum total number of records (in this case interactions) over time. So the X-axis would be dates and the Y axis would be a sum total of all the records.
For instance, if there are 5 interactions in Week 1 and then 7 interactions in week 2, the week 1 number would be 5 but the week 2 number should be 12 (5 + 7). If week 3 had 7 more interactions, it should be 19 (12 + 7).
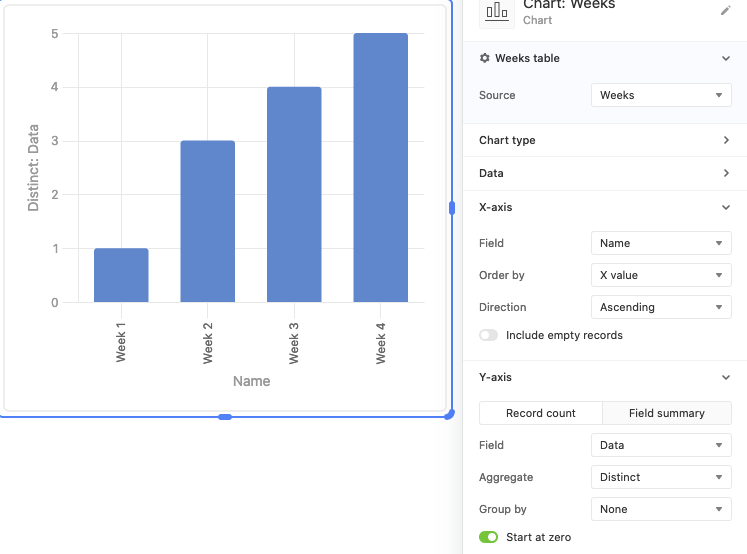
As far as I can tell this is impossible in Airtable interfaces. Does anyone have a similar problem or potential workaround?