Help

The Community will be temporarily unavailable starting on Friday February 28. We’ll be back as soon as we can! To learn more, check out our Announcements blog post.

How to Filter Out Null Values in a Chart

Topic Labels: Data Interface Designer
1359 2
cancel
Showing results for 
Search instead for 
Did you mean: 
Lizbeth_Pena_Fl
5 - Automation Enthusiast

Hi, 

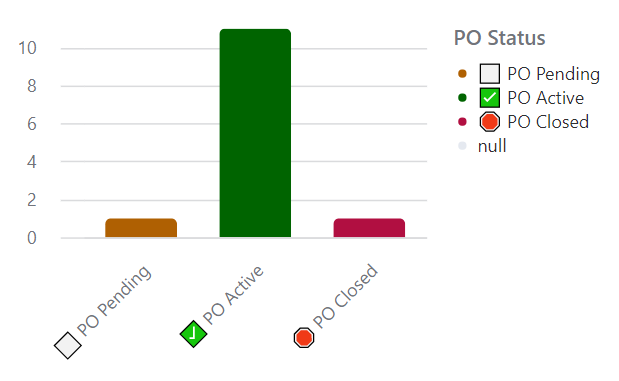
I am creating a chart that shows Purchase Orders grouped by status, but I am getting a group for "null." The status field is a drop-down single select with the 3 options below.  I've confirmed that the status of all records is not empty. I have also tried manually adding a filter to filter out records where the status is empty, but I still get the "null" group. 

How can I get rid of the "null" grouping in the chart? 

Lizbeth_Pena_Fl_0-1693935383016.png


2 Replies 2
John_Baronian
4 - Data Explorer
4 - Data Explorer

Hi were you able to resolve this. We have a similar issue with no null fields in our y axis value. 

If we change the field type to a number the null goes away but so do the color choices based on the type of select (single/multi).  I have a feeling that the "Add Option" select field is the Null that shows up....


Hey John, unfortunately I did not find a solution. I resigned myself to try to ignore the null group in the meantime.