Help

The Community will be undergoing maintenance on Friday January 10 at 2:00pm - Saturday January 11 at 2:00pm EST, and will be "read-only." For assistance during this time, please visit our Help Center.

Re: Interface Chart Value's are Displaying in Wrong Order

2942 0
cancel
Showing results for 
Search instead for 
Did you mean: 
Daniel_Hamer
5 - Automation Enthusiast

Hi there.

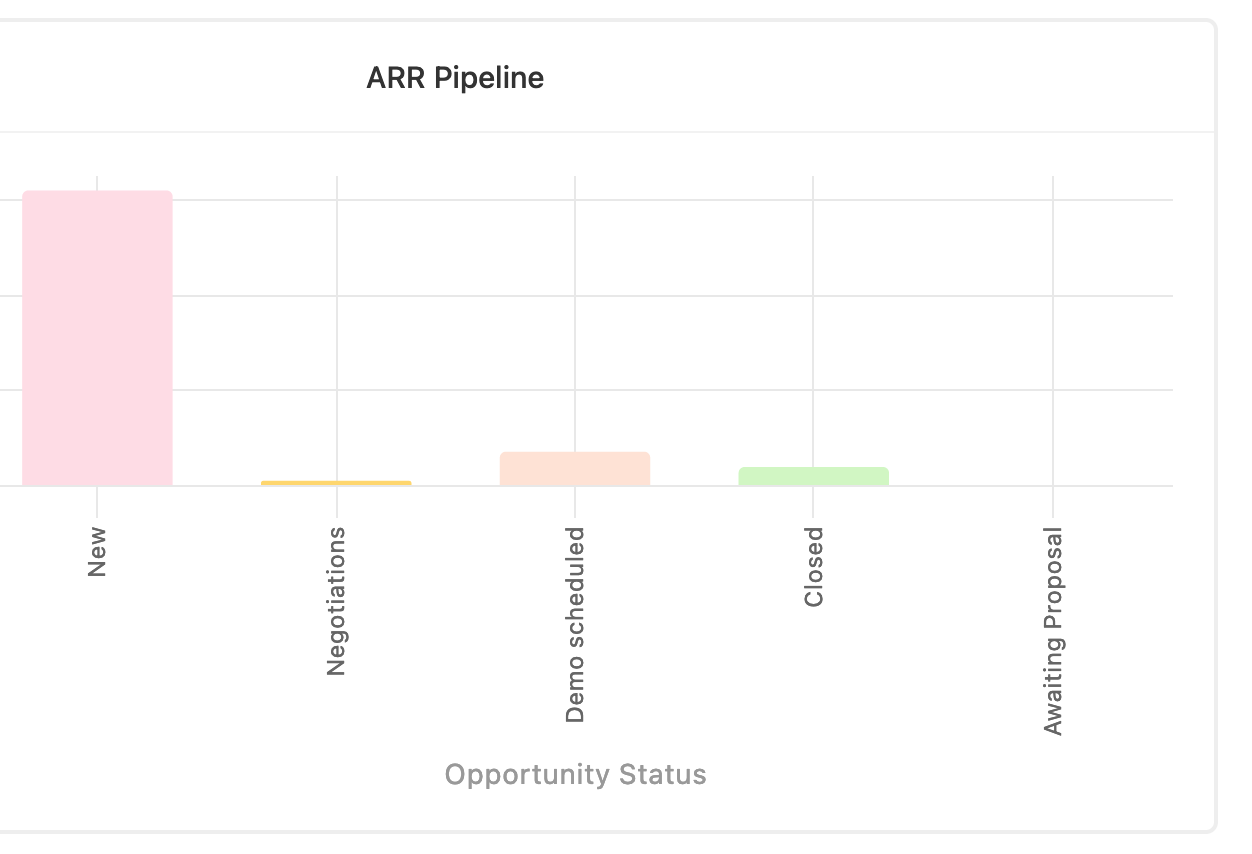
I’m facing a problem in some of my interfaces where the value’s are not appearing in the right order whether I change it from Ascending to Descending.

For example. I have a bar chart as below where all the weeks are in the wrong order:

airtable issue

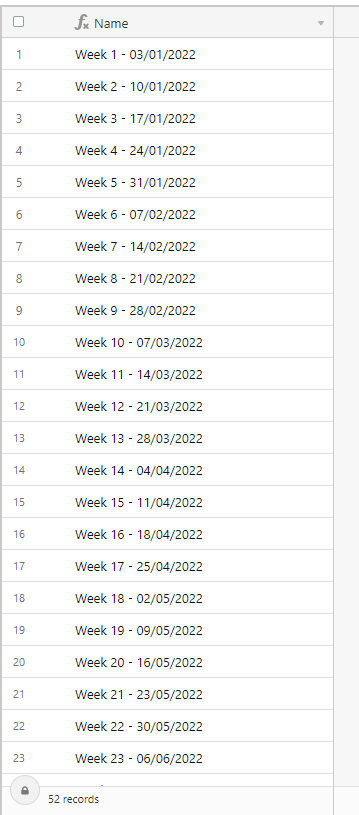
I’m pulling the 'Week’s from a table as follows. Weeks are a linked record.
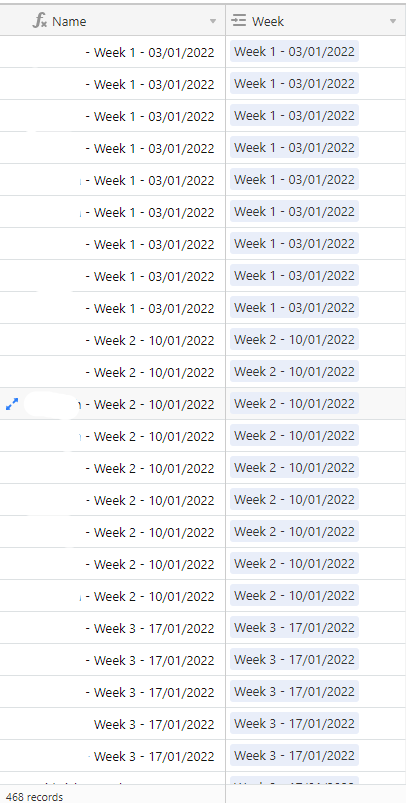
weeks linked record

weeks

Can someone explain what I’m doing wrong here?

Thanks
Dan

6 Replies 6
Birch_Eve
4 - Data Explorer
4 - Data Explorer

Hey Dan,

Did you get this figured out? We’re having the same issue

Colin_Forward
4 - Data Explorer
4 - Data Explorer

Bump. Also having this issue
Notification_Center

Nick_Garn
5 - Automation Enthusiast

Similar problem here. I need the ability to sort a line chart by a non numeric field.

There are several different ways to set the sort order.

  • Alphabetical sort (This is what happens when none of the other situations apply.)
  • Numeric sort (This requires a number field, not a text string that looks like a number.)
  • Date sort (This requires the field be a date field, not just text string that looks like a date to a human.)
  • Select choice sort (The order of select choice as defined when configuring the field. This requires that the value be a select field.)

Can I confirm that this sorting cannot be done within the interface? That the x-axis choice must be one of these that you listed for the interface to not automatically revert to Alphabetical? My X-Axis is a column with month and year (AUG-22) which cannot unfortunately be sorted as a date (it’s text) without adding in an irrelevant and confusing day.

For Jess…

Add a date field to your data. Pick the end of the month. You can then hide that field. Now, in the interface use the Date field as your X-Axis and change the “Bucket by” to Month. That’s how I did it for your use case.