Is it possible to put a label on the Points in a scatter plot?
Easy in gSheets. Can't figure out how to do this in AirTable.
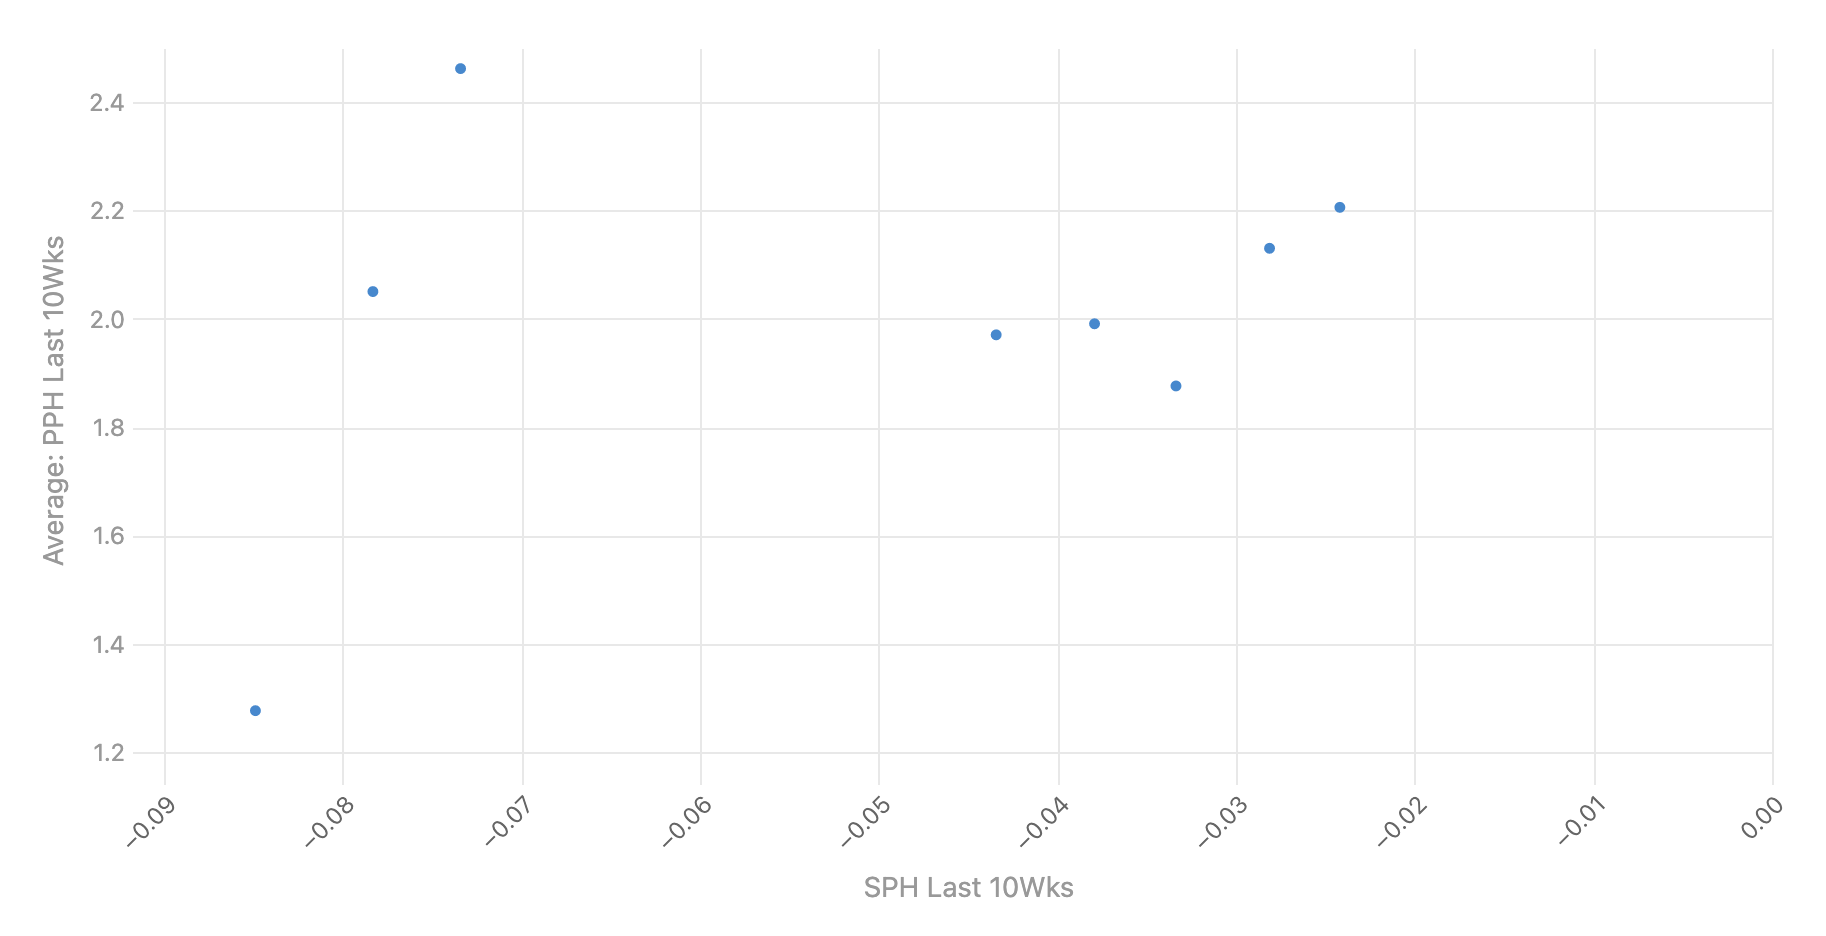
Airtable Chart:
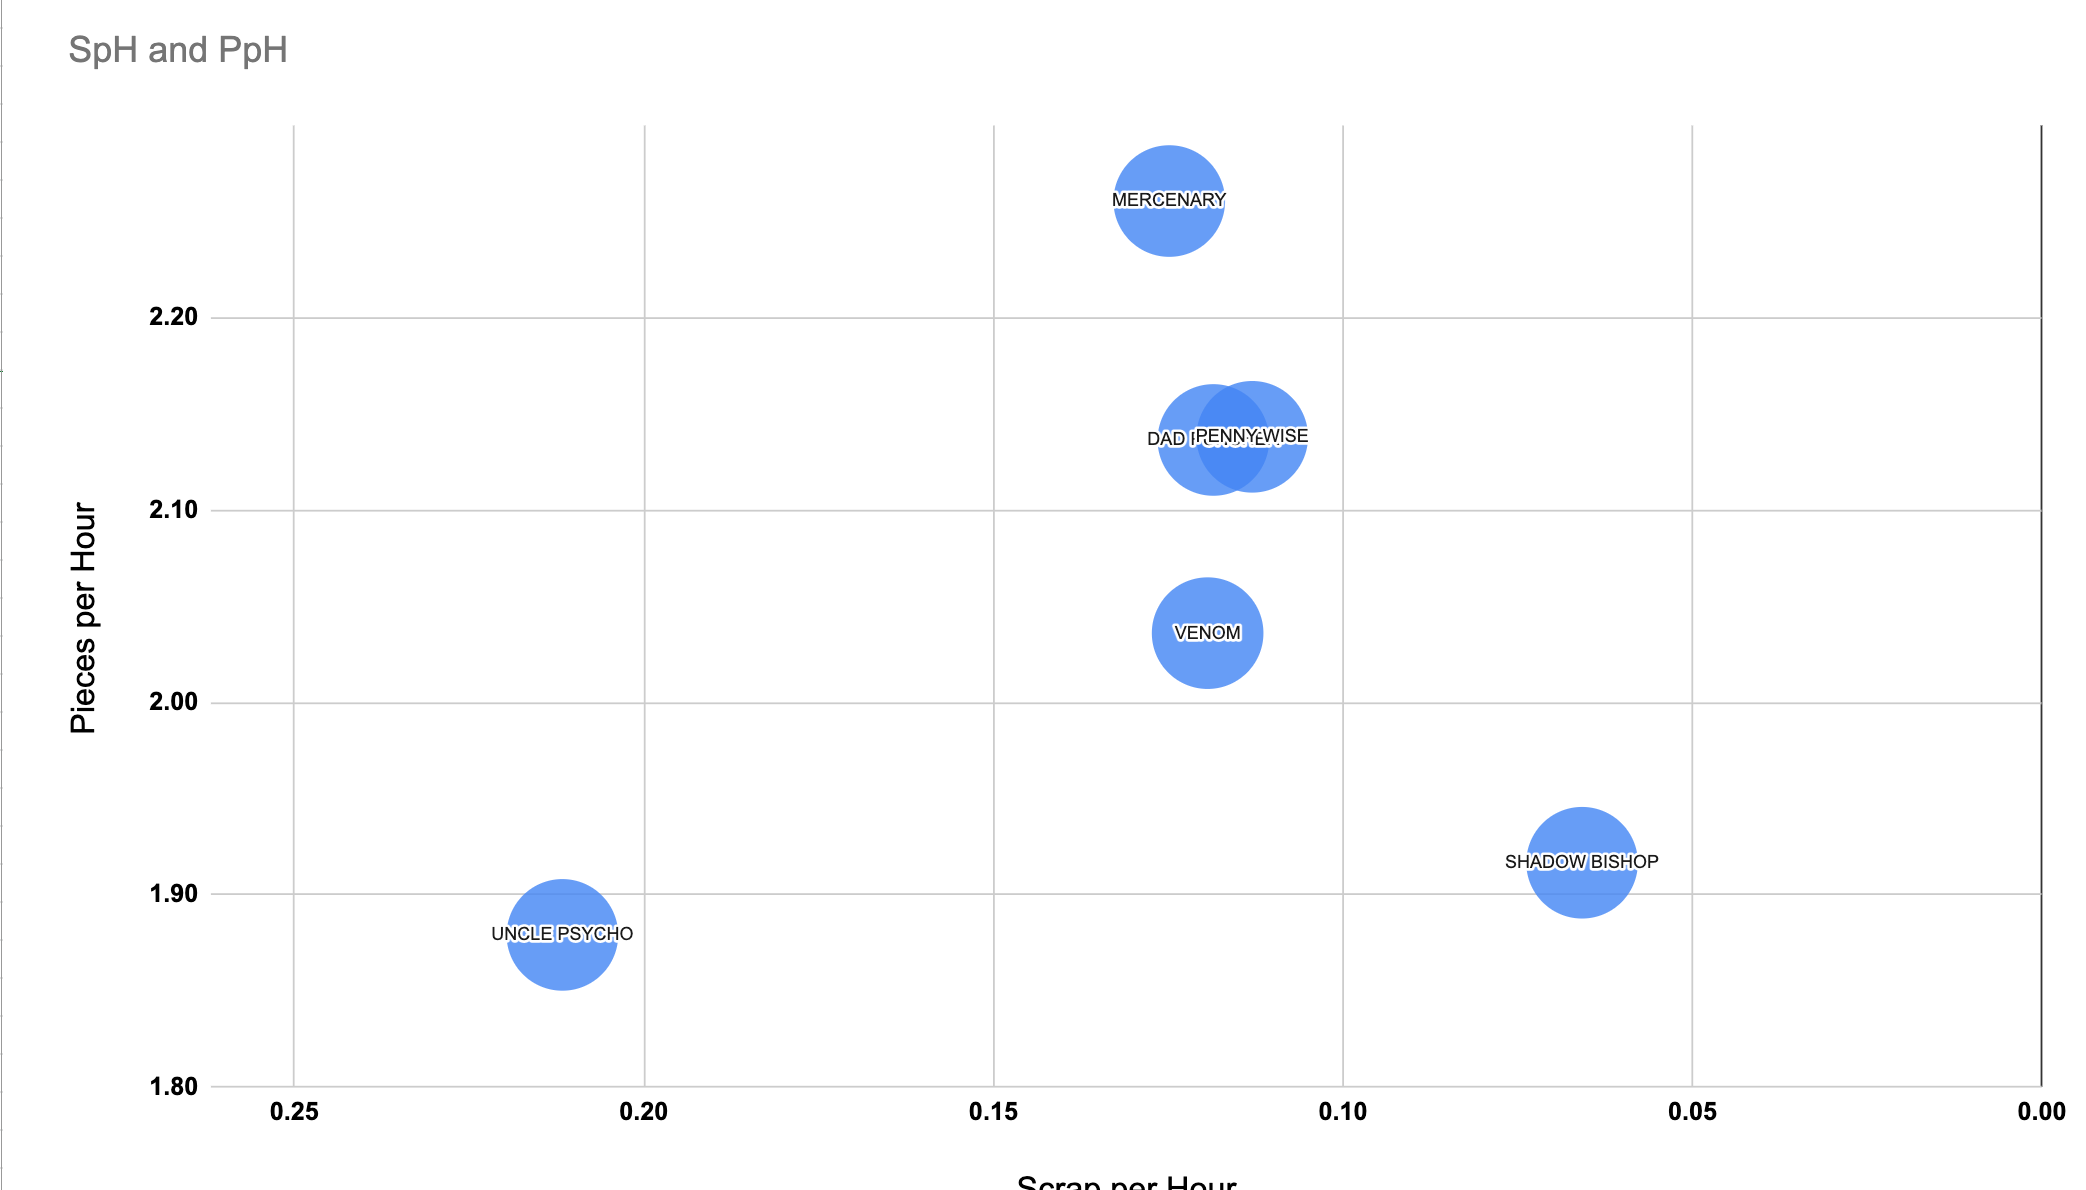
gSheet Chart:

 +1
+1Is it possible to put a label on the Points in a scatter plot?
Easy in gSheets. Can't figure out how to do this in AirTable.
Airtable Chart:
gSheet Chart:
Enter your E-mail address. We'll send you an e-mail with instructions to reset your password.
