Help

Re: Auto search/sort/group/filter data

1523 0
cancel
Showing results for 
Search instead for 
Did you mean: 
Debbie_LaFollet
4 - Data Explorer
4 - Data Explorer

I have imported raw data from an evaluation form using linear values. Is there a way to auto search/sort/group/filter the data with <=2 and have a field where it then lists the names of the columns that return that value of <=2?

This is kinda what I’m wanting from the data:
John Smith (Client) needs training in Microsoft Word (2) and Microsoft Excel (1) but doesn’t need training in Microsoft PowerPoint (4).

5 Replies 5

Hello @Debbie_LaFollette-Sa! Welcome in!

I originally saw this post a few days ago and while the solution is quite simple, I tried approaching it from a few different methods.

Here’s how I would solve your problem:

Data Model


The first approach I experimented with was to create two separate tables. One for your clients, and the second one for your different software platforms.

The problem I ran into was that while you had the ability to associate different pieces of software to a given client, you could not rank a user competency score depending on which platforms were associated with your clients.

With that in mind, I decided to take the approach of assuming that you only had a set list of all the software that you would need to individually rank.

So, I created just a single table called Clients.

For each record, I built rating fields for each piece of software using a five-point scale.


Determining Rankings

Since we now have data from the individual fields, we have a couple of ways that we can combine that data to get a composite score.

There are quite a few ways to accomplish what you’re looking to do.
I’ve included a few different ways you can do it, but the simplest is the next section immediately below.

All of the methods I list are really just the same thing, but with small adjustments for things like how you want things to appear or react.

The Short and Simple Way:

The straightforward way to accomplish what you want to do is to either:

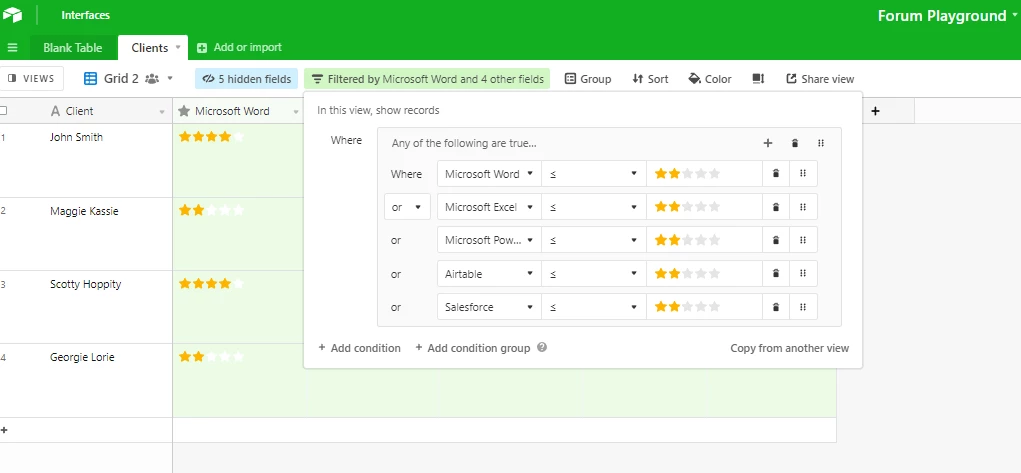
  1. Create a view that will only display client records that have a value of 0-2.
    Here’s what the filter configuration would kinda look like.

image

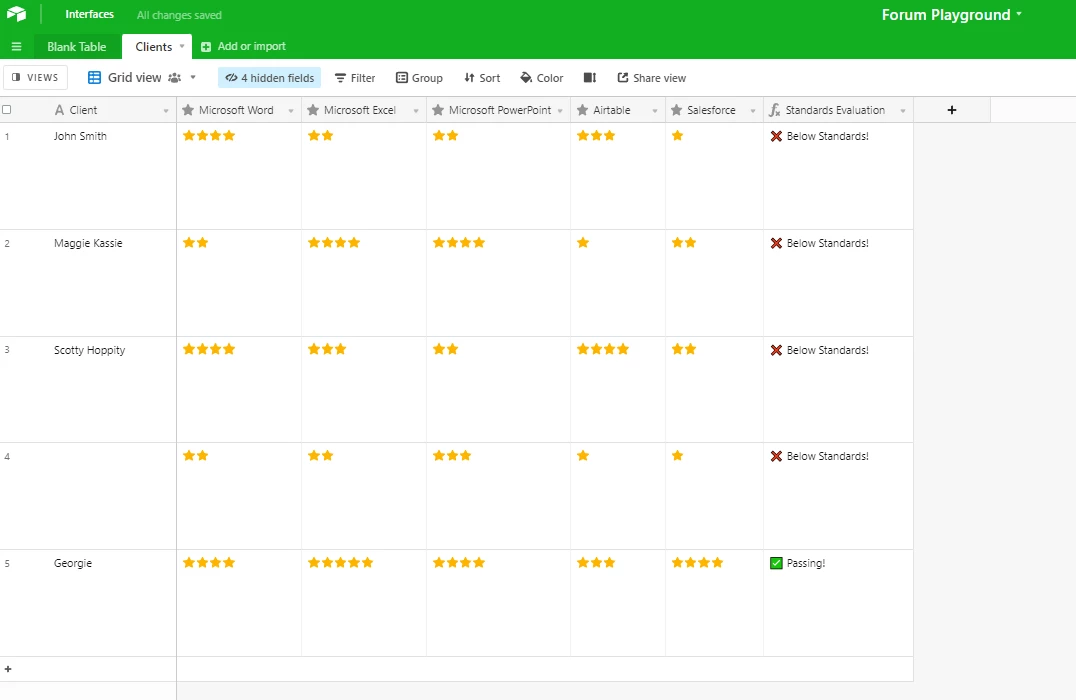
  1. Use a formula field that flags when a record has a rating that is 2 <=.

Here’s what the simple formula method looks like.

image

And here’s the formula behind it:

IF(
    OR(
        {Microsoft Word} <= 2,
        {Microsoft Excel} <= 2,
        {Microsoft PowerPoint} <= 2,
        {Airtable} <= 2,
        {Salesforce} <= 2
    ),
    "❌ Below Standards!",
    "✅ Passing!"
)

Method One: Percentage Competency

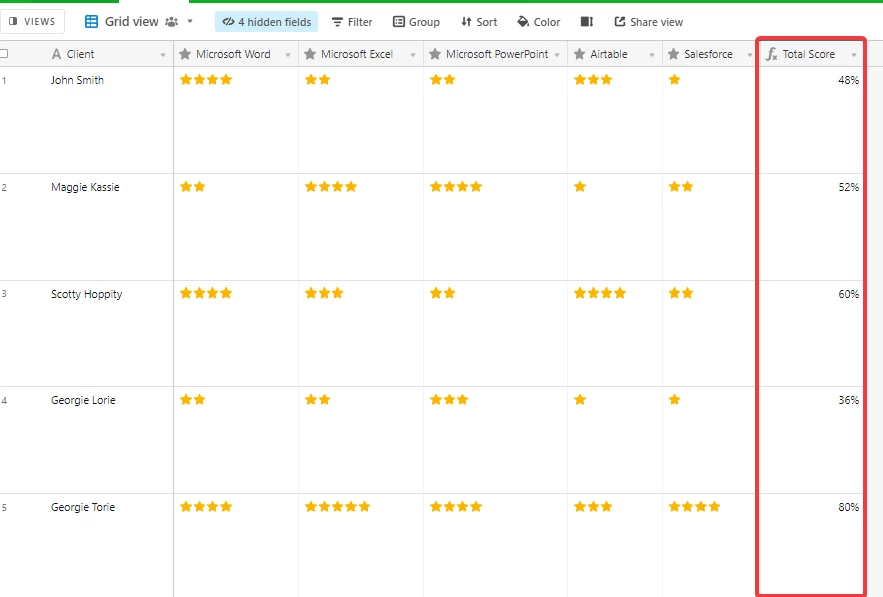
The first method is to create a percentage-based competency score.

It’s a simple formula that just takes the aggregate and shoots out a percentage.

image

Here’s the formula if you’re curious:

SUM(
    {Microsoft Word},
    {Microsoft Excel},
    {Microsoft PowerPoint},
    {Airtable},
    {Salesforce}
) / 25

If you’re trying to replicate the exact results, you will need to format the formula results into a percentage using the formula format settings in the field config.

Additionally, if you choose to use this method, you will need to remove or add your own fields into the formula. Definitely let me know if you need any guidance on doing so.


Method Two: Individual Competency Scoring

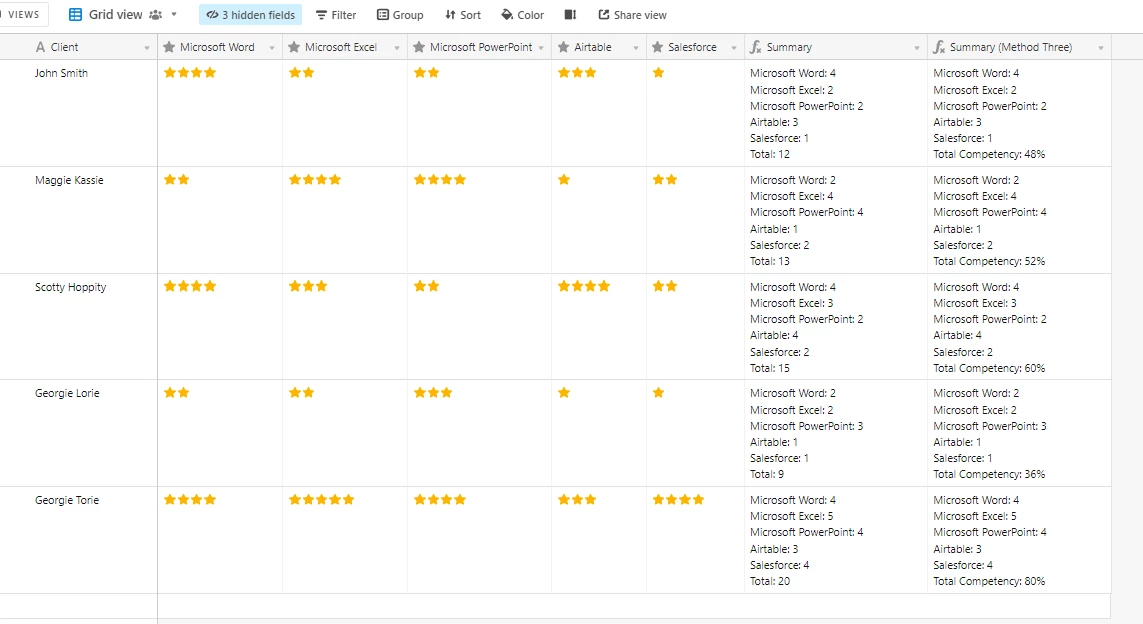
This method takes a full summary of the entire client performance and also provides you with an aggregate integer at the bottom.

Here’s the formula for this method:

IF(
    {Client},
    "Microsoft Word: " & {Microsoft Word} & "\n" &
    "Microsoft Excel: " & {Microsoft Excel} & "\n" &
    "Microsoft PowerPoint: " & {Microsoft PowerPoint} & "\n" &
    "Airtable: " & {Airtable} & "\n" &
    "Salesforce: " & {Salesforce} & "\n" & "Total Competency: " &
    (
        SUM(
        {Microsoft Word},
        {Microsoft Excel},
        {Microsoft PowerPoint},
        {Airtable},
        {Salesforce}
        ) / 25 * 100
    ) & "%",
    "Please Provide Client Information"
)

The field in this screenshot is called Summary.

image

Method Three: Percent Based Individual Competency Scoring

This one is just number two, but with the bottom aggregate score being turned into a percentage.
The field in the screenshot is labeled with Method Three.

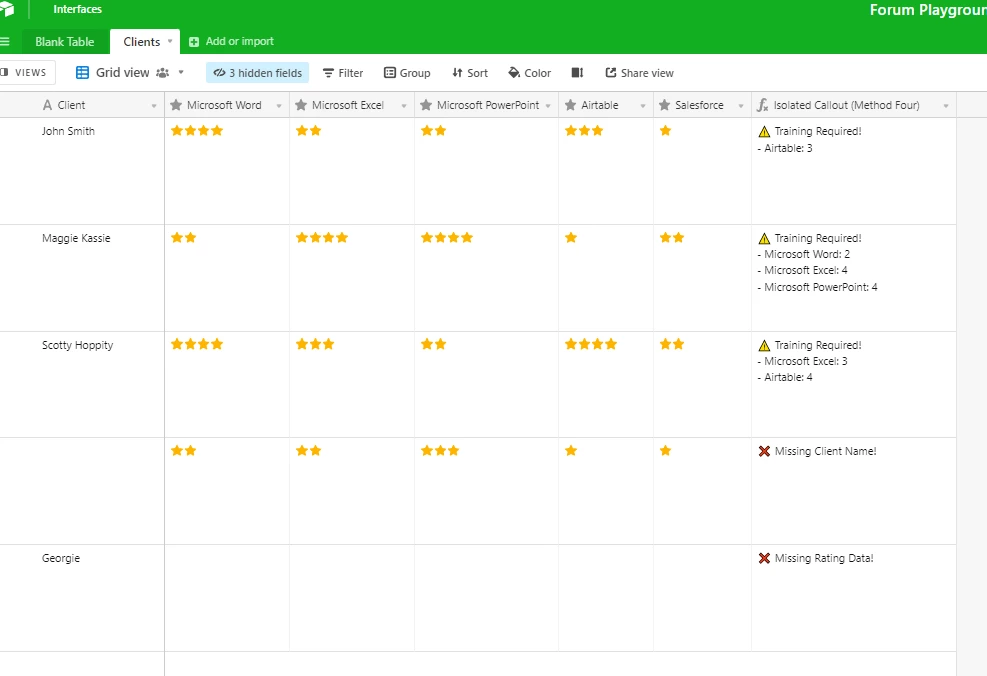
Method Four: Isolated Callouts

This was some fun practice.
This method is the most dynamic.

Here are the rules:

  • If no data is present, it will return blank.
  • If a name is provided, but no rating info is provided, then it will alert you to a lack of data.
  • If a name is missing, but data is present, it will alert you to a missing name.

image

If you want it, here’s the formula behind it:

IF(
    NOT(
        AND(
            {Client},
            {Microsoft Word},
            {Microsoft Excel},
            {Microsoft PowerPoint},
            {Airtable},
            {Salesforce}
        )
    ),
    IF(
        AND(
            OR(
                {Microsoft Word},
                {Microsoft Excel},
                {Microsoft PowerPoint},
                {Airtable},
                {Salesforce}
            ),
            {Client} = 0
        ),
        "❌ Missing Client Name!"
    )
    & 
    IF(
        AND(
            {Client},
            NOT(
                OR(
                    {Microsoft Word},
                    {Microsoft Excel},
                    {Microsoft PowerPoint},
                    {Airtable},
                    {Salesforce}
                )
            )
        ),
        "❌ Missing Rating Data!"
    ),
    "⚠ Training Required!" & "\n" &
    IF(
        OR(
            {Microsoft Word} = 1,
            {Microsoft Word} = 2
        ),
        "- Microsoft Word: " & {Microsoft Word} & "\n"
    )
    &
    IF(
        OR(
            {Microsoft Excel} = 1,
            {Microsoft Excel} = 2
        ),
        '',
        "- Microsoft Excel: " & {Microsoft Excel} & "\n"
    )
    &
    IF(
        OR(
            {Microsoft PowerPoint} = 1,
            {Microsoft PowerPoint} = 2
        ),
        '',
        "- Microsoft PowerPoint: " & {Microsoft PowerPoint} & "\n"
    )
    &
    IF(
        OR(
            {Airtable} = 1,
            {Airtable} = 2
        ),
        '',
        "- Airtable: " & {Airtable} & "\n"
    )
    &
    IF(
        OR(
            {Salesforce} = 1,
            {Salesforce} = 2
        ),
        '',
        "- Salesforce: " & {Salesforce} & "\n"
    )
)

Again, the additional methods I posted are overkill, but worth looking at if you want to play around with how the data is presented.

I just ended up going down a rabbit hole of building out different solutions when I was working out your use case. The end result was that I ended up unintentionally building things out without really thinking much about it.

Instead of tossing my practice, I figured that it would probably be beneficial at some point for someone if they want to reference this post in the future.

Debbie_LaFollet
4 - Data Explorer
4 - Data Explorer

Thanks so much for this. It helped me understand things a bit better. Your third example is more what I’m looking for but I’ve yet to get it to work. I don’t need the \n nor the ‘missing client data’. I’m just wanting the column name (training module) displayed that they need training on. I though the filtering version 1 would work, but I couldn’t get it to work right either :frowning: so I’m obviously still missing something.

@Debbie_LaFollette-Sa

Were you able to get a solution in place for your use case?

Hi Ben,
The Isolated Callouts is more like what I’m needing to do. Unfortunately, I’ve still not been able to get it to work with my real data. :frowning:

@Debbie_LaFollette-Sa -

Here’s a shared link to the base I used to create the original model.

Feel free to copy it and take a look at how it works.
Always feel free to reply and ask me as many questions as you want!