Help

Re: Chart visualization

2668 2
cancel
Showing results for 
Search instead for 
Did you mean: 
Tobin_Perry
6 - Interface Innovator

I have a table in my base that I use to track “energy level” which is rated 1-10. Each record also has a timestamp on it. I’d like to create a table that charts energy levels on an average day. I’m thinking I need an average energy level for each one-hour increment. Any suggestions?
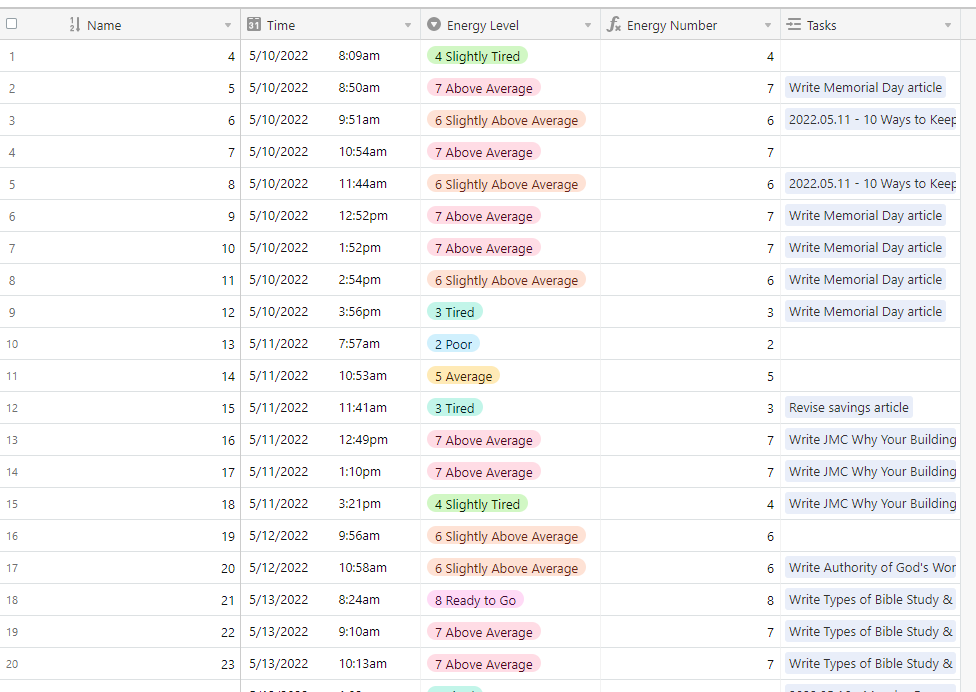
Capture

5 Replies 5

Hey Tobin, could you check this out? You should be able to view the chart’s settings

I’m not too familiar with the chart app but this seems to do what you want!

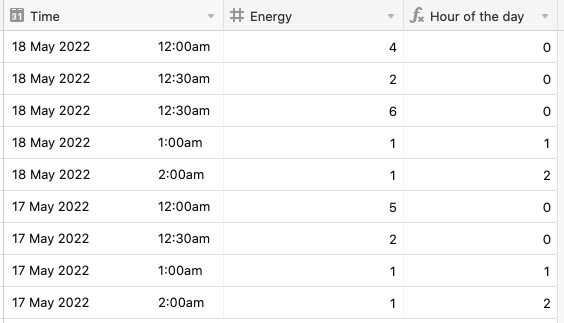
Idea is we make an “Hour of the day” field with the formula HOUR([DATE TIME FIELD])
Screenshot 2022-05-18 at 11.52.17 AM

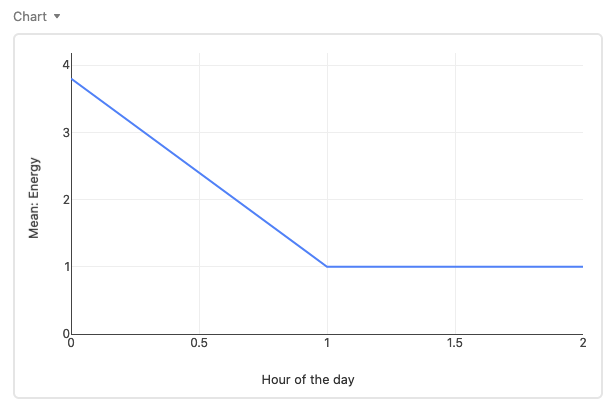
And then we use the chart’s Mean function to just handle the rest
Screenshot 2022-05-18 at 11.52.19 AM

Let me know if this doesn’t work; I’ve always wanted to play with the Chart app more but never had the opportunity, so this is pretty great

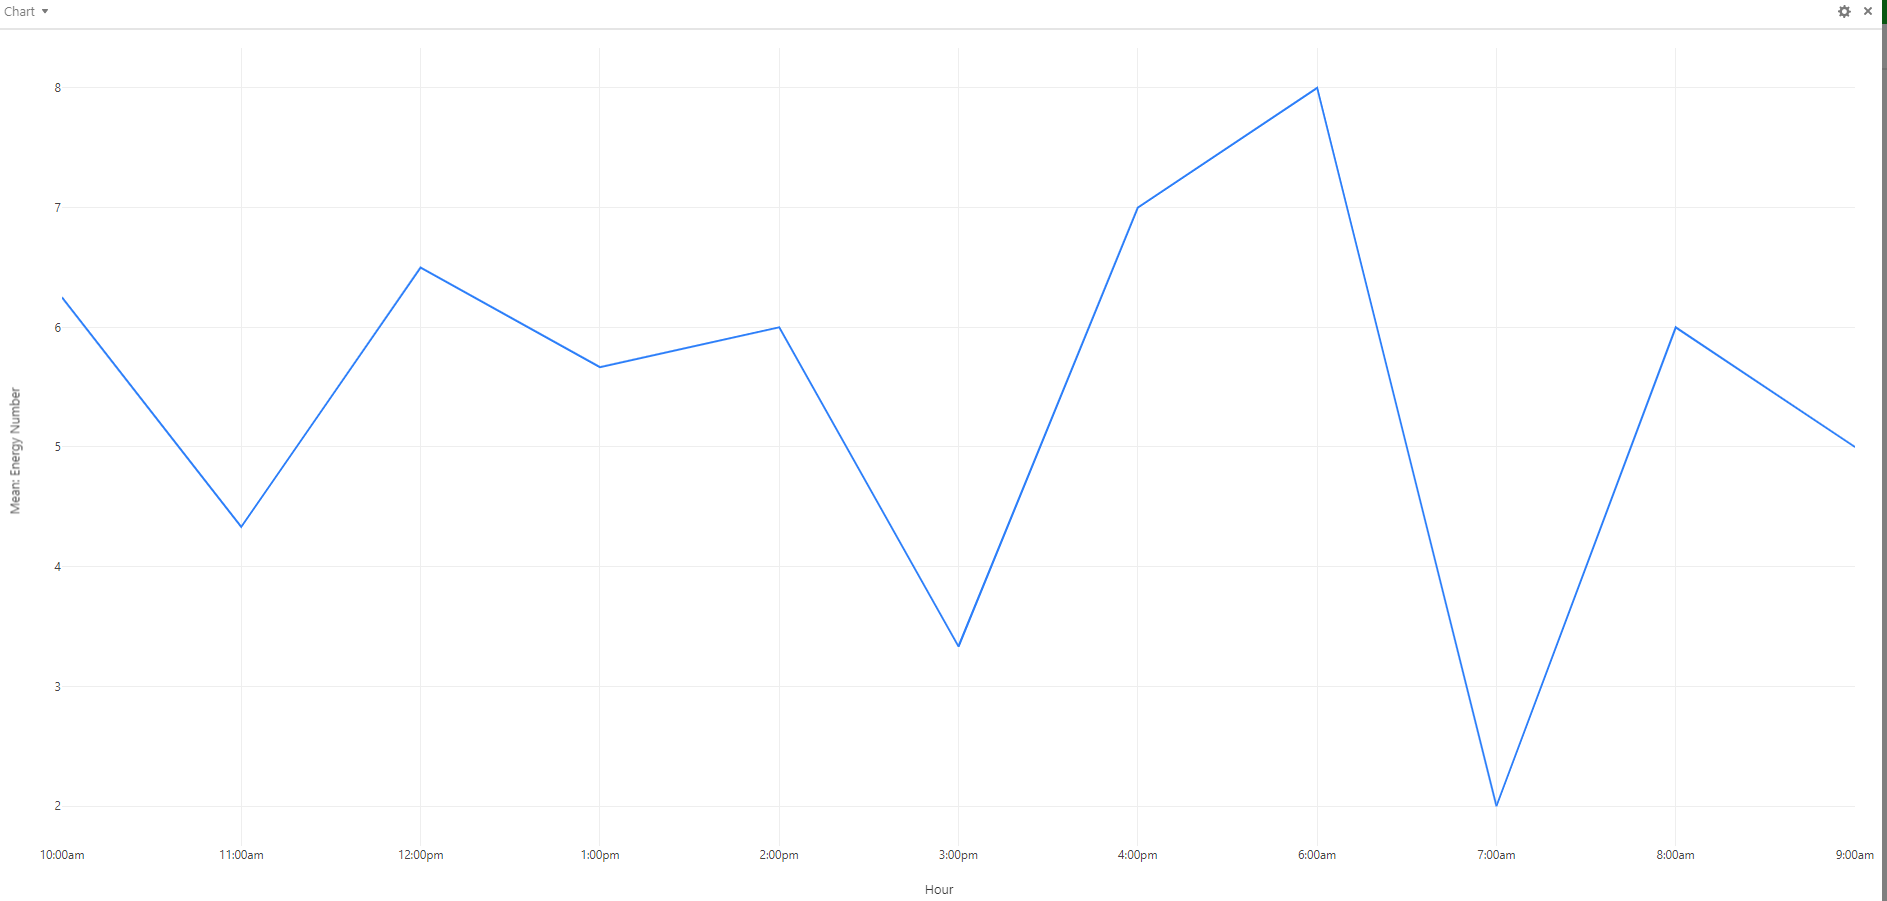
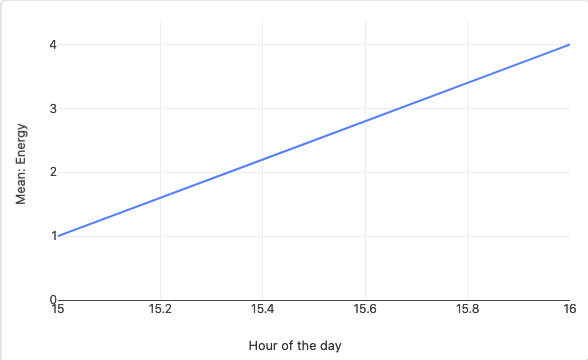
That works! But any idea why the Hour at the bottom doesn’t start at 6:00am and end at 4:00pm?

image001.png

Hmm, do you have any records for 6 - 6:59 am and 4 - 4:59 pm?

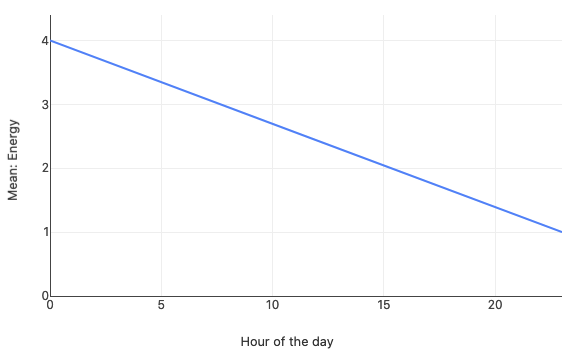
I got the chart below to show the hours 0 - 24 with just two records in the base, one at 12 am and one at 11:30 pm, so I think it may be due to there not being any records for those hours in your data

Screenshot 2022-05-18 at 10.41.58 PM

Screenshot 2022-05-18 at 10.42.32 PM

Thanks Adam,

There is one record between 4-4:59. The odd part is that it starts at 10am. 6am is there but it’s not until after 4pm. I wonder if it has something to do with GMT?

Tobin

Intruiging! I toggled “Use the same timezone” off for my field, and the chart changed to this instead:

Screenshot 2022-05-19 at 7.34.47 AM

Definitely seems like it’s a timezone thing