Charting or displaying summaries of data with multiple conditions
I am trying to summarize data that I can display in a chart.
I have a table of projects with a column for clients assigned to the projects. Two separate payments are made to each client for each product. I am tracking whether the payment has been “paid” or is “outstanding” as well as the fiscal year the payment was or is expected to be paid. So the relevant columns in the table are:
Client
Payment 1 Amount ($ value)
Payment 1 Status (“paid” or “outstanding”)
Payment 1 Year (2010, 2011, 2012, etc)
Payment 2 Amount ($ value)
Payment 2 Status (“paid” or “outstanding”)
Payment 2 Year (2010, 2011, 2012, etc)
I’d like to create a summary table and/or chart that shows paid vs outstanding combined payment amounts for each fiscal year. For example, I would easily see that so far in 2018, I have paid $17,000 and there are $25,000 outstanding payments. And for 2019, I’m expecting $40,000 in total payments etc.
The main challenge I’m having is that I cannot simply combine payment 1 with payment 2 into a new column because it’s possible that payment 1 is “paid” while 2 is still “outstanding” and it’s also possible that within a given project, the two payments could correspond to different fiscal years.
I have created formula columns for each fiscal year that totals the paid and outstanding amounts for each client. This gives me the numbers I need at the bottom of the view in the automatic summary row, but it involved creating tons of additional columns - 2 for each year (which is fine) - but I can’t seem to find a way to show that info in a pivot table, matrics, or chart easily since it’s spread out between columns instead of rows.
I hope I’ve explained that well.
Thank you!
Page 1 / 1
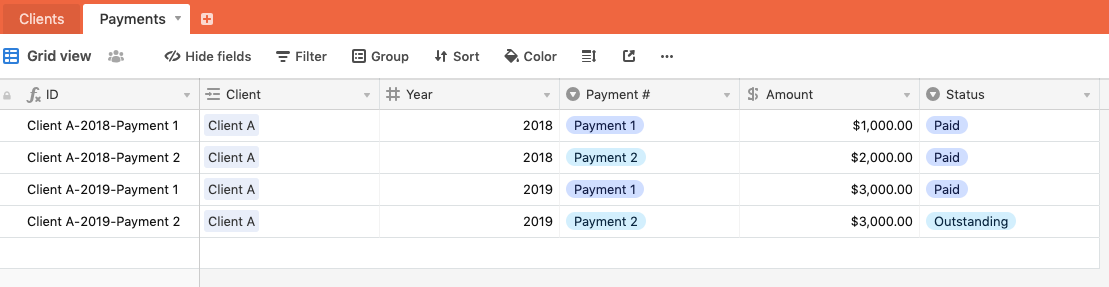
Hi @Jonathan_Gunnell - A slight change to the data model might give you what you need. Rather than have payments as columns, I would try treating each payment as a record with statuses of payment1/payment2 and paid/outstanding:
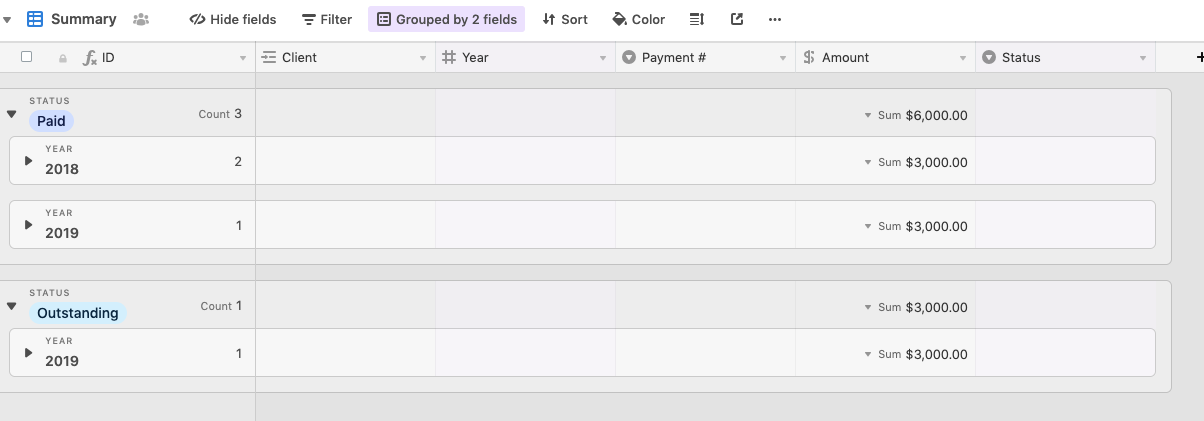
You can then create another view to group and summarise this as you see fit - in the case below by paid status, then by year:
Does that give you what you want?
JB
Hi JB,
Thanks for the response. The issue is that the records are actually tied to even deeper fields. I left that detail out to try to simplify it. The main column corresponds to the project and each project can have multiple clients. So I’m already having to duplicate an additional “project” row to accommodate the multiple clients, with multiple roles, assigned to the project. If I then need to be redundant again to accommodate the two separate payments, things are going to get pretty out of control with having so many rows for each project. To further complicate that, these projects are reoccurring. So 2 years from now, I’ll have a new version of that project with a new client with two corresponding payments etc…
I did find a solution that at least got me some of the data I needed. It involved 4 new columns to the main table:
Payment 1 Paid - pulls the amount of payment 1 IF its status is “paid”
Payment 1 Unpaid - pulls the amount of payment 1 IF its status is “outstanding”
Payment 2 Paid - pulls the amount of payment 2 IF its status is “paid”
Payment 2 Unpaid - pulls the amount of payment 2 IF its status is “outstanding”
Note: the fiscal year columns are both linked to a fiscal year table.
Then in the table with the linked fiscal years, rolled up the “payment 1 paid” amounts in a column, the “payment 2 paid” amounts in a column, and summed them together in another column to get the total paid in that fiscal year. Then did the same for outstanding payments.
Hi @Jonathan_Gunnell - if what you have got working so far works for you then go with it. You know your process and the whole idea behind Airtable is to organise your data in a way that works for you.
That said (and appreciate that this might not work for you), based on your second note and looking at the base you have embedded, I would tend to look at this data model in a slightly different way. It seems to me you have 3 key “objects” - projects, clients and payments. If I were building this base for you, I would start with these 3 tables and iterate it from there. You’ve got a table for payment years - I probably wouldn’t do this as I think “year” is an attribute of a “payment” which I can use to group, sort, report on later. You’ve also got “payment type” (payment 1, payment 2) as columns, whereas, again, I would see these as payment attributes that I can report on once set
(Just FYI, I would do it this way because, in reality, there isn’t any difference between payment 1 and payment 2 - both have an amount, are assigned to a project/client and so on. From the point of view of database design, having payments as an object with many payment rows allows me to modify a project in the future to have, say 3 payments. In your model 3 payments would need more columns which then might be more difficult to implement across the whole base, depending upon links, lookups, rollups etc).
I don’t want to criticise your base, because if it works for you that’s great and, of course, I don’t really know exactly (or even roughly) what you process, workflow or requirements are, but just throwing my two pence worth in
FWIW here’s a quick mock up of my approach:
JB
The real data is actually much more complicated. Without a table for payment years, how could I report on the data I’m using that table for in the example (total paid vs. outstanding for a given year)? In your example, I wouldn’t be able to group by project. In the real data, I’m already dealing with a lot of projects, each of which reoccurs as new versions and each version has redundant rows (author + reviewer).
Here’s an anonymized version that includes additional fields I need to track to give you a better idea of the scope of the data.
The usage of “term” throughout the data refers to an academic term (e.g., Fall 2019, Spring 2020, Summer 2020…)
Basically, I need to track projects, clients assigned to the projects and their role in the project, payments to clients, staff assigned to the project and their workload, the dates term) the project is being developed and launched. I need to report on payments (paid and projected) to clients by term as well.