Hi!
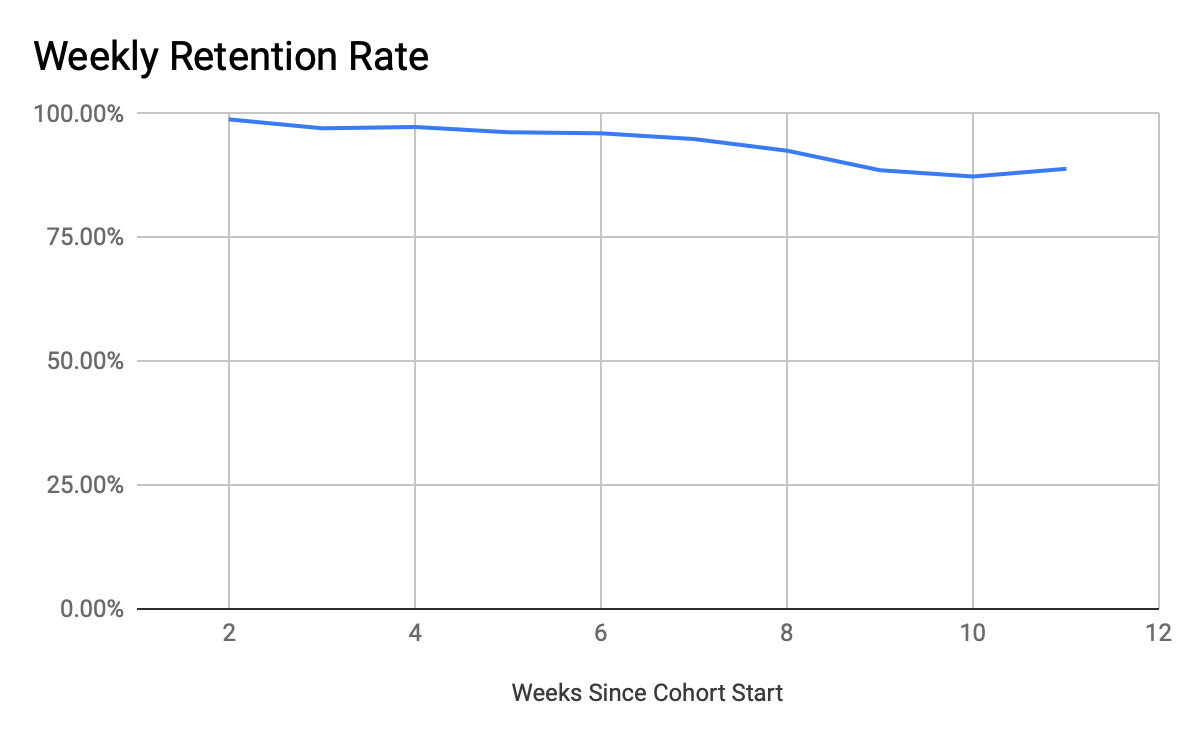
I have some customer data that includes the date they signed up & the date they canceled. Each row is a customer. I want to calculate my customer retention and have done it using google sheets. My current solution uses a column for week1, week2, week3…etc a series of IF statements to determine if the customer was retained (1) or churned (0). Then, my summary row at the bottom can tell me my churn rate.
What I’m wondering is two things: how can I transpose those summaries from being spread across columns to something I can chart in Vega lite.
OR
Is there a way to avoid creating all of these extra columns and running these cumulative summaries in JSON/Vega lite

