Hello all,
I’m relatively new to Airtable and am trying to optimize my experience in my day job as a stock/securities analyst.
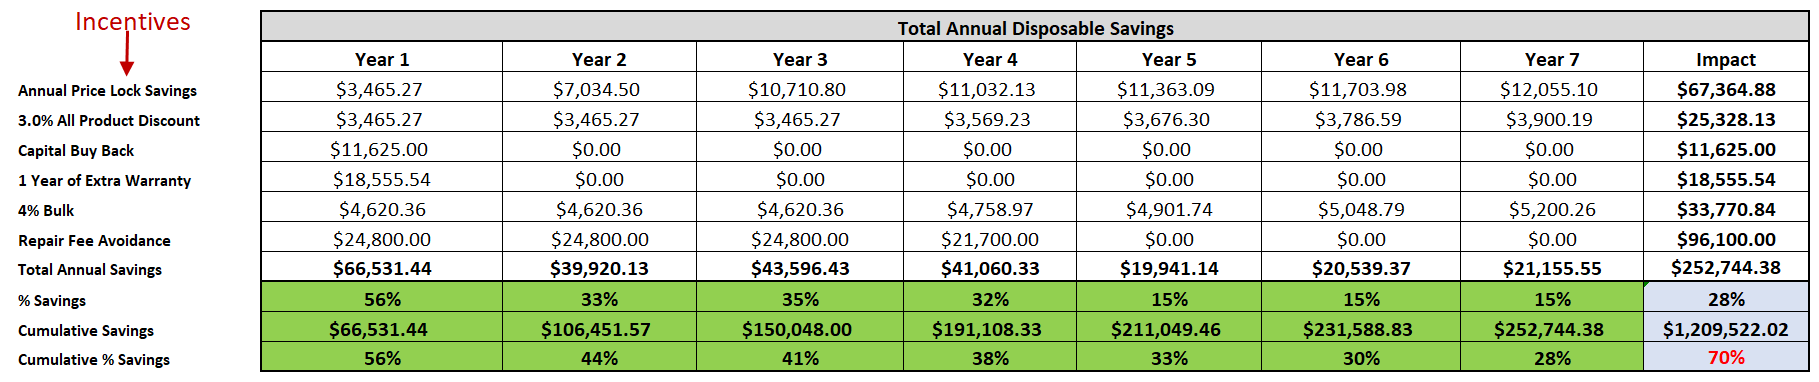
The main problem is Airtable is built to have a single type of value represented in a column. Excel is different in that data is expressed a field at a time, so you can have a column with all sorts of different data represented, which is ideal when each column is, say, a time period – such as a fiscal year.
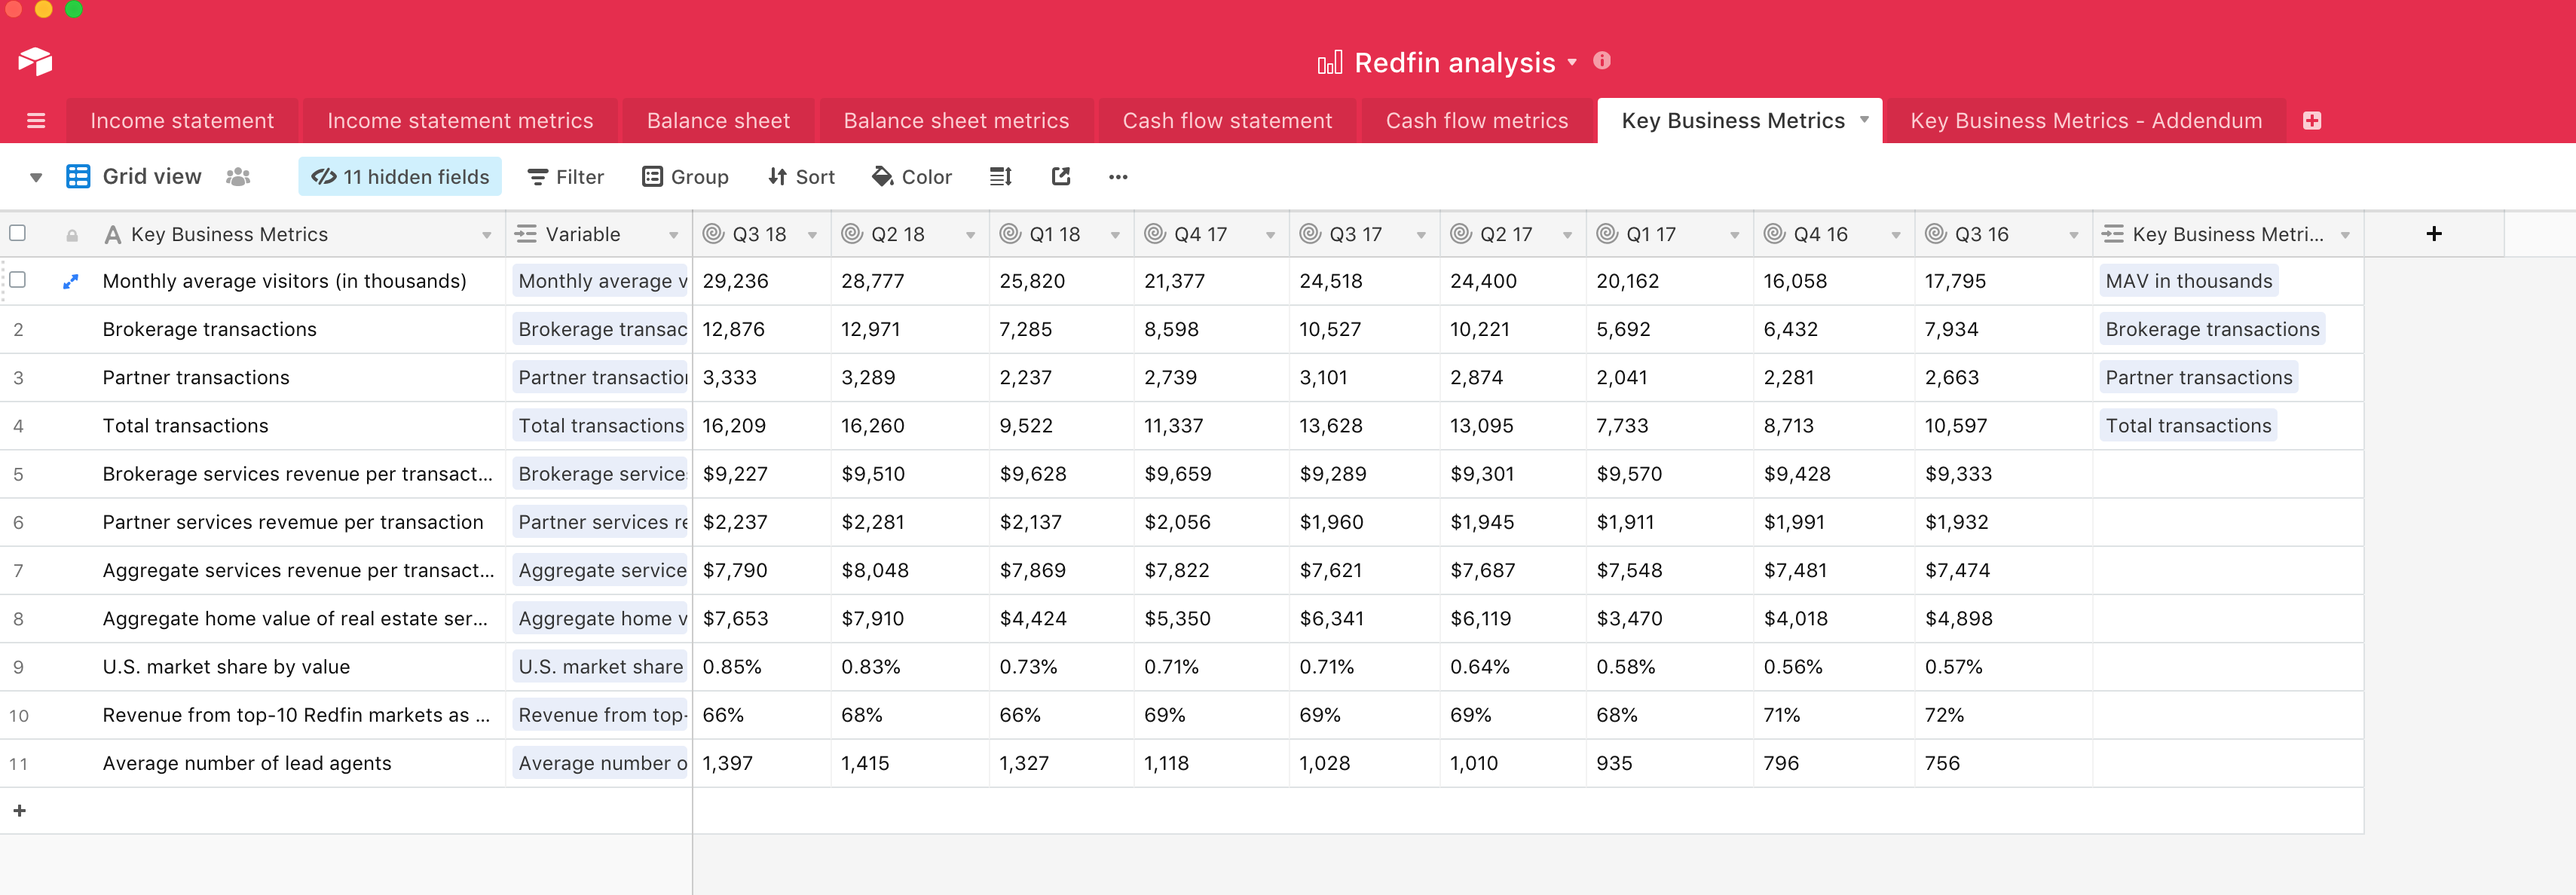
I’ve hacked this a bit in Airtable by reversing the order: years / periods on the left axis and financial variables and formulas on the horizontal, and then expressing the data in a gallery.
That works but its less than ideal for sharing with my teammates since many are Excel power users. Airtable works better for me because I can embed it and it’s easier (for me) to read and keeps everything in a single digital notebook that’s accessible at my Mac at work and equally on my phone.
My goal is to figure out how to create a traditional, Excel-looking Airtable for financial statements that I can then do creative analysis against. Having that format would make it a lot easier to import or copy-paste. Right now I do the work a line at a time.