
Good morning, I’m trying to create a gantt chart in which I can represent a proyect with different beginnings and ends. But instead of appearing below, continues in another start date on the same line, as it shows in the following picture:


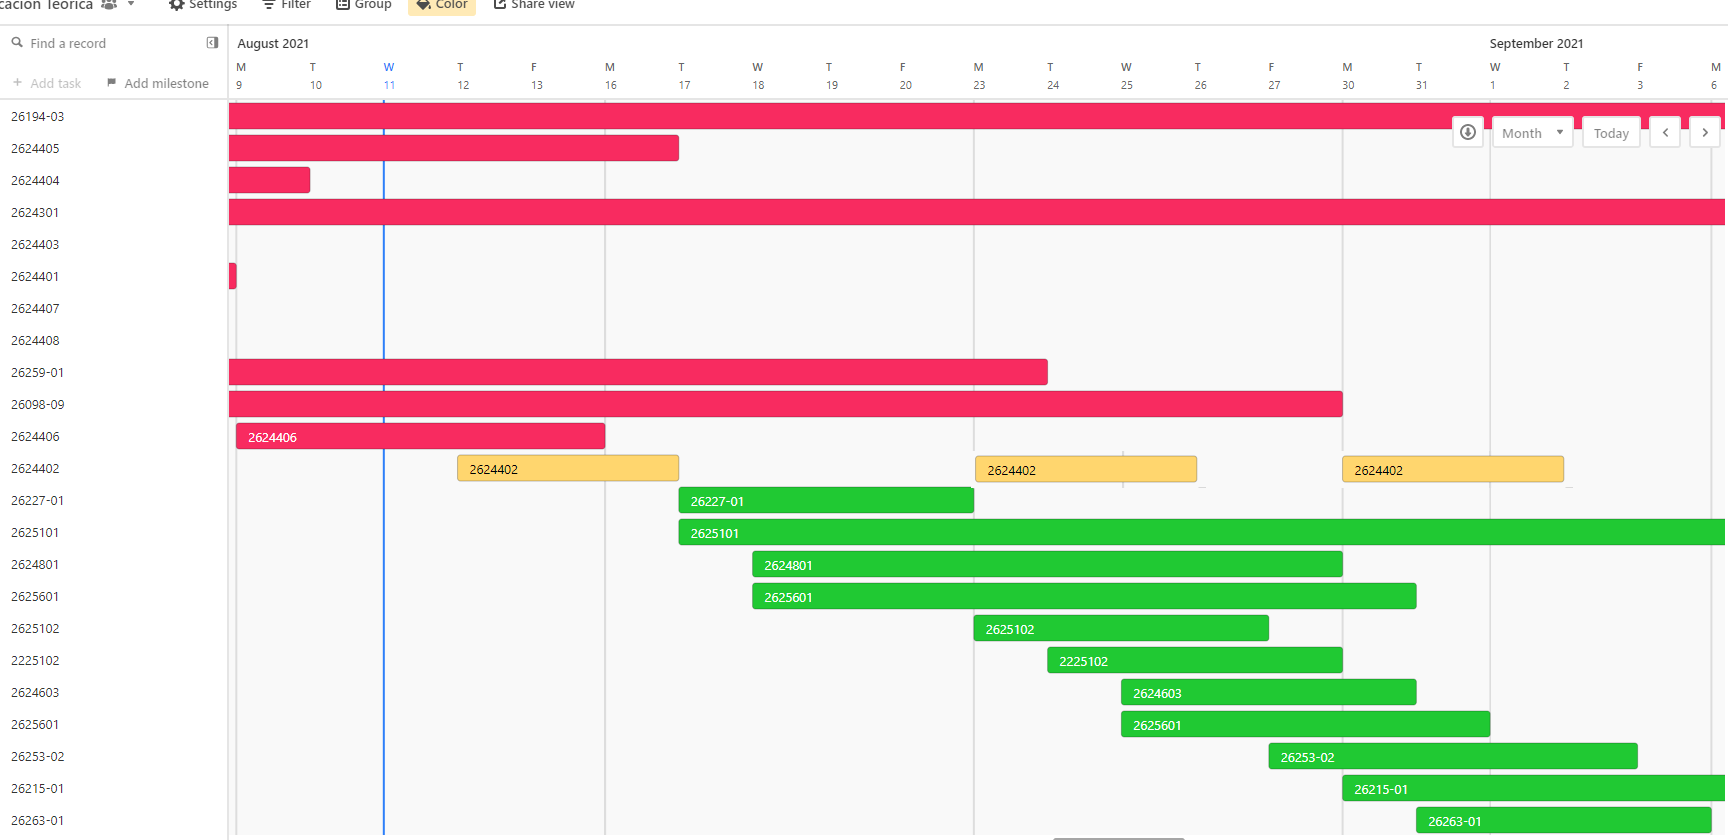
The project 26324402 (orange (?)) I modified it in paint to explain my idea.


I thank you a lot

Welcome to the community, @IEA_Escobar! :grinning_face_with_big_eyes: Each line in the Gantt chart represents a single Airtable record. Because of that, it’s not possible for a record to appear more than once on the same line. To have a given project repeat in different ranges of time, each instance will need to be a separate record, and will appear as a separate line in the chart.


Reply