Help

Re: How can I create a histogram or something similar?

1812 0
cancel
Showing results for 
Search instead for 
Did you mean: 
Scott_Campbell
4 - Data Explorer
4 - Data Explorer

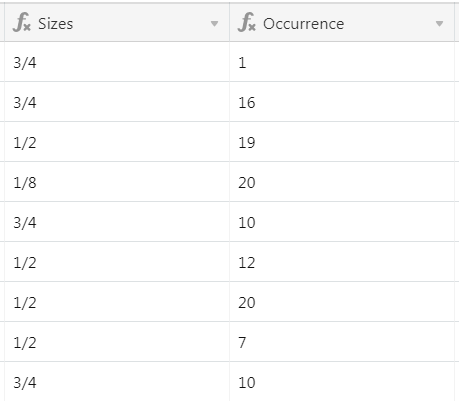
Hello, I am working on an inventory system for my plants. I have the following data for different sizes (1/8, 1/2, 3/4 or empty) and have a corresponding number of occurrences of those values. I am looking to make a pivot table or chart that displays the total number of each size. Example: From this image there would be a 37 - 3/4, 58 - 1/2, & 20 -1/8. The sizes unfortunately can’t be predetermined using a multi selection field because the size is a function of time since planting.

Any help would be appreciated. Thanks!
Capture

3 Replies 3

If you have the pro version, you can use their built in Chart Block.

Would that work?

Hi Nathalie,

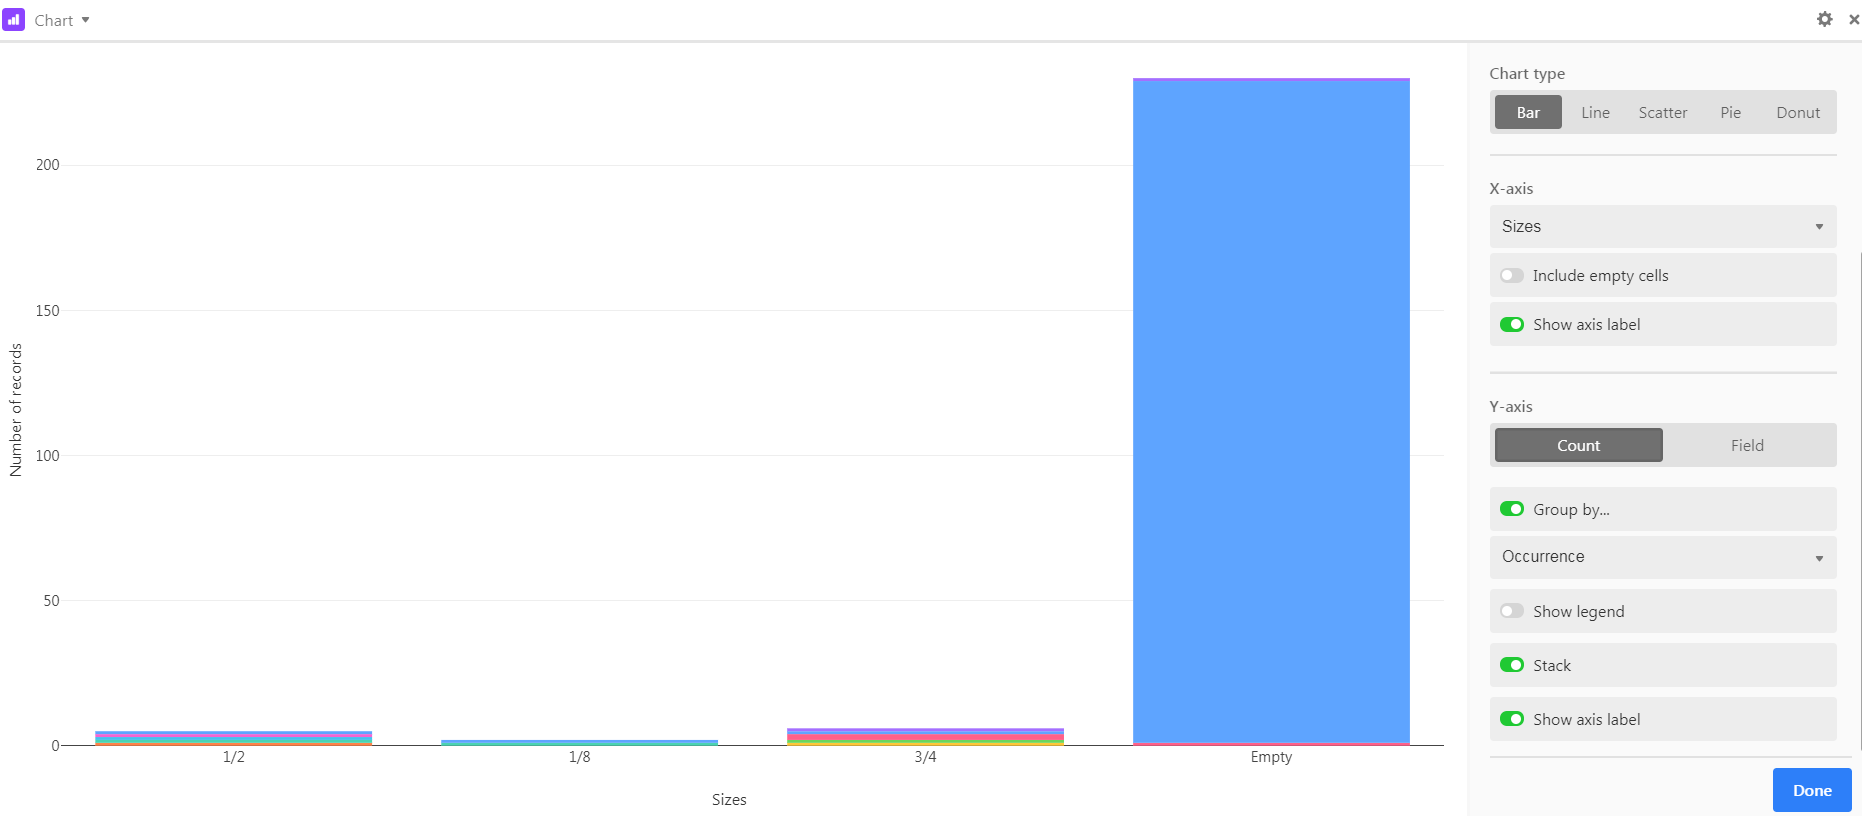
Thanks for the input. I have been playing around with various iterations of the bar graph option in the Chart Blocks. This is as far as i can get. While this does visually show a cumulative sum I am not able to label the graph with this info. Also I would like to create the X axis in order of size (1/8, 1/2 3/4). Instead the axis are labelled in the order they are found in the field. Another idea i had is if I could get the info in another format such as;

Column 1 Column 2
1/8 20
1/2 58
3/4 37

Is there a way to do this? I’m much more familiar with excel and trying to apply that logic here and I think that’s where i’m running into issues.

(Don’t mind the “Empty category” I cropped the first image I posted to exclude this info)
Capture.PNG

@Scott_Campbell

Naming Y-axis
To my knowledge, there is no way to name it. It names it based on what it’s calculating.

Size Order
The system is confusing your fractions. In my sample, my output was identical order as yours (1/2,1/8,3/4) – even when I tried various things to put them out of that order.

Try putting a 1,2,3 in front of the fraction (or some other naming convention).

When I sampled it, I tried with the 1,2,3 and it put it in the respective orders.
1 - 1/8
2 - 1/2
3 - 3/4

Other Format
In the example that you provide for the other format, I’m not sure exactly what the 20, 58 and 37 represent however, it looks like you might be trying to create a pivot table. If so, that’s a separate block. Have a look at my sample base. Is this what you’re looking for perhaps?

NOTE: for the blocks to work for you, you’ll need to copy this base into your paid workspace.